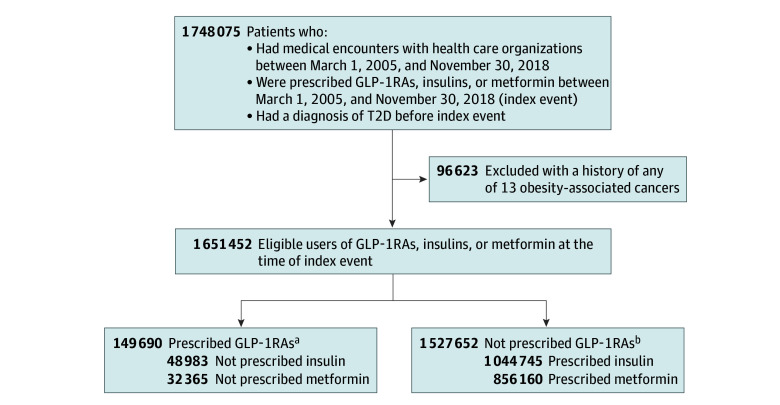
Figure 1. Study Group Selection Flow Diagram .
T2D indicates type 2 diabetes.
aThe combined total of patients is not necessarily a sum of the individuals from each of the groups because individuals could be prescribed both glucagon-like peptide 1 receptor agonists (GLP-1RAs) and insulins or metformin during the study period.
bThe combined total of patients is not necessarily a sum of the individuals from each of the groups because individuals could be prescribed both insulins and metformin during the study period.

