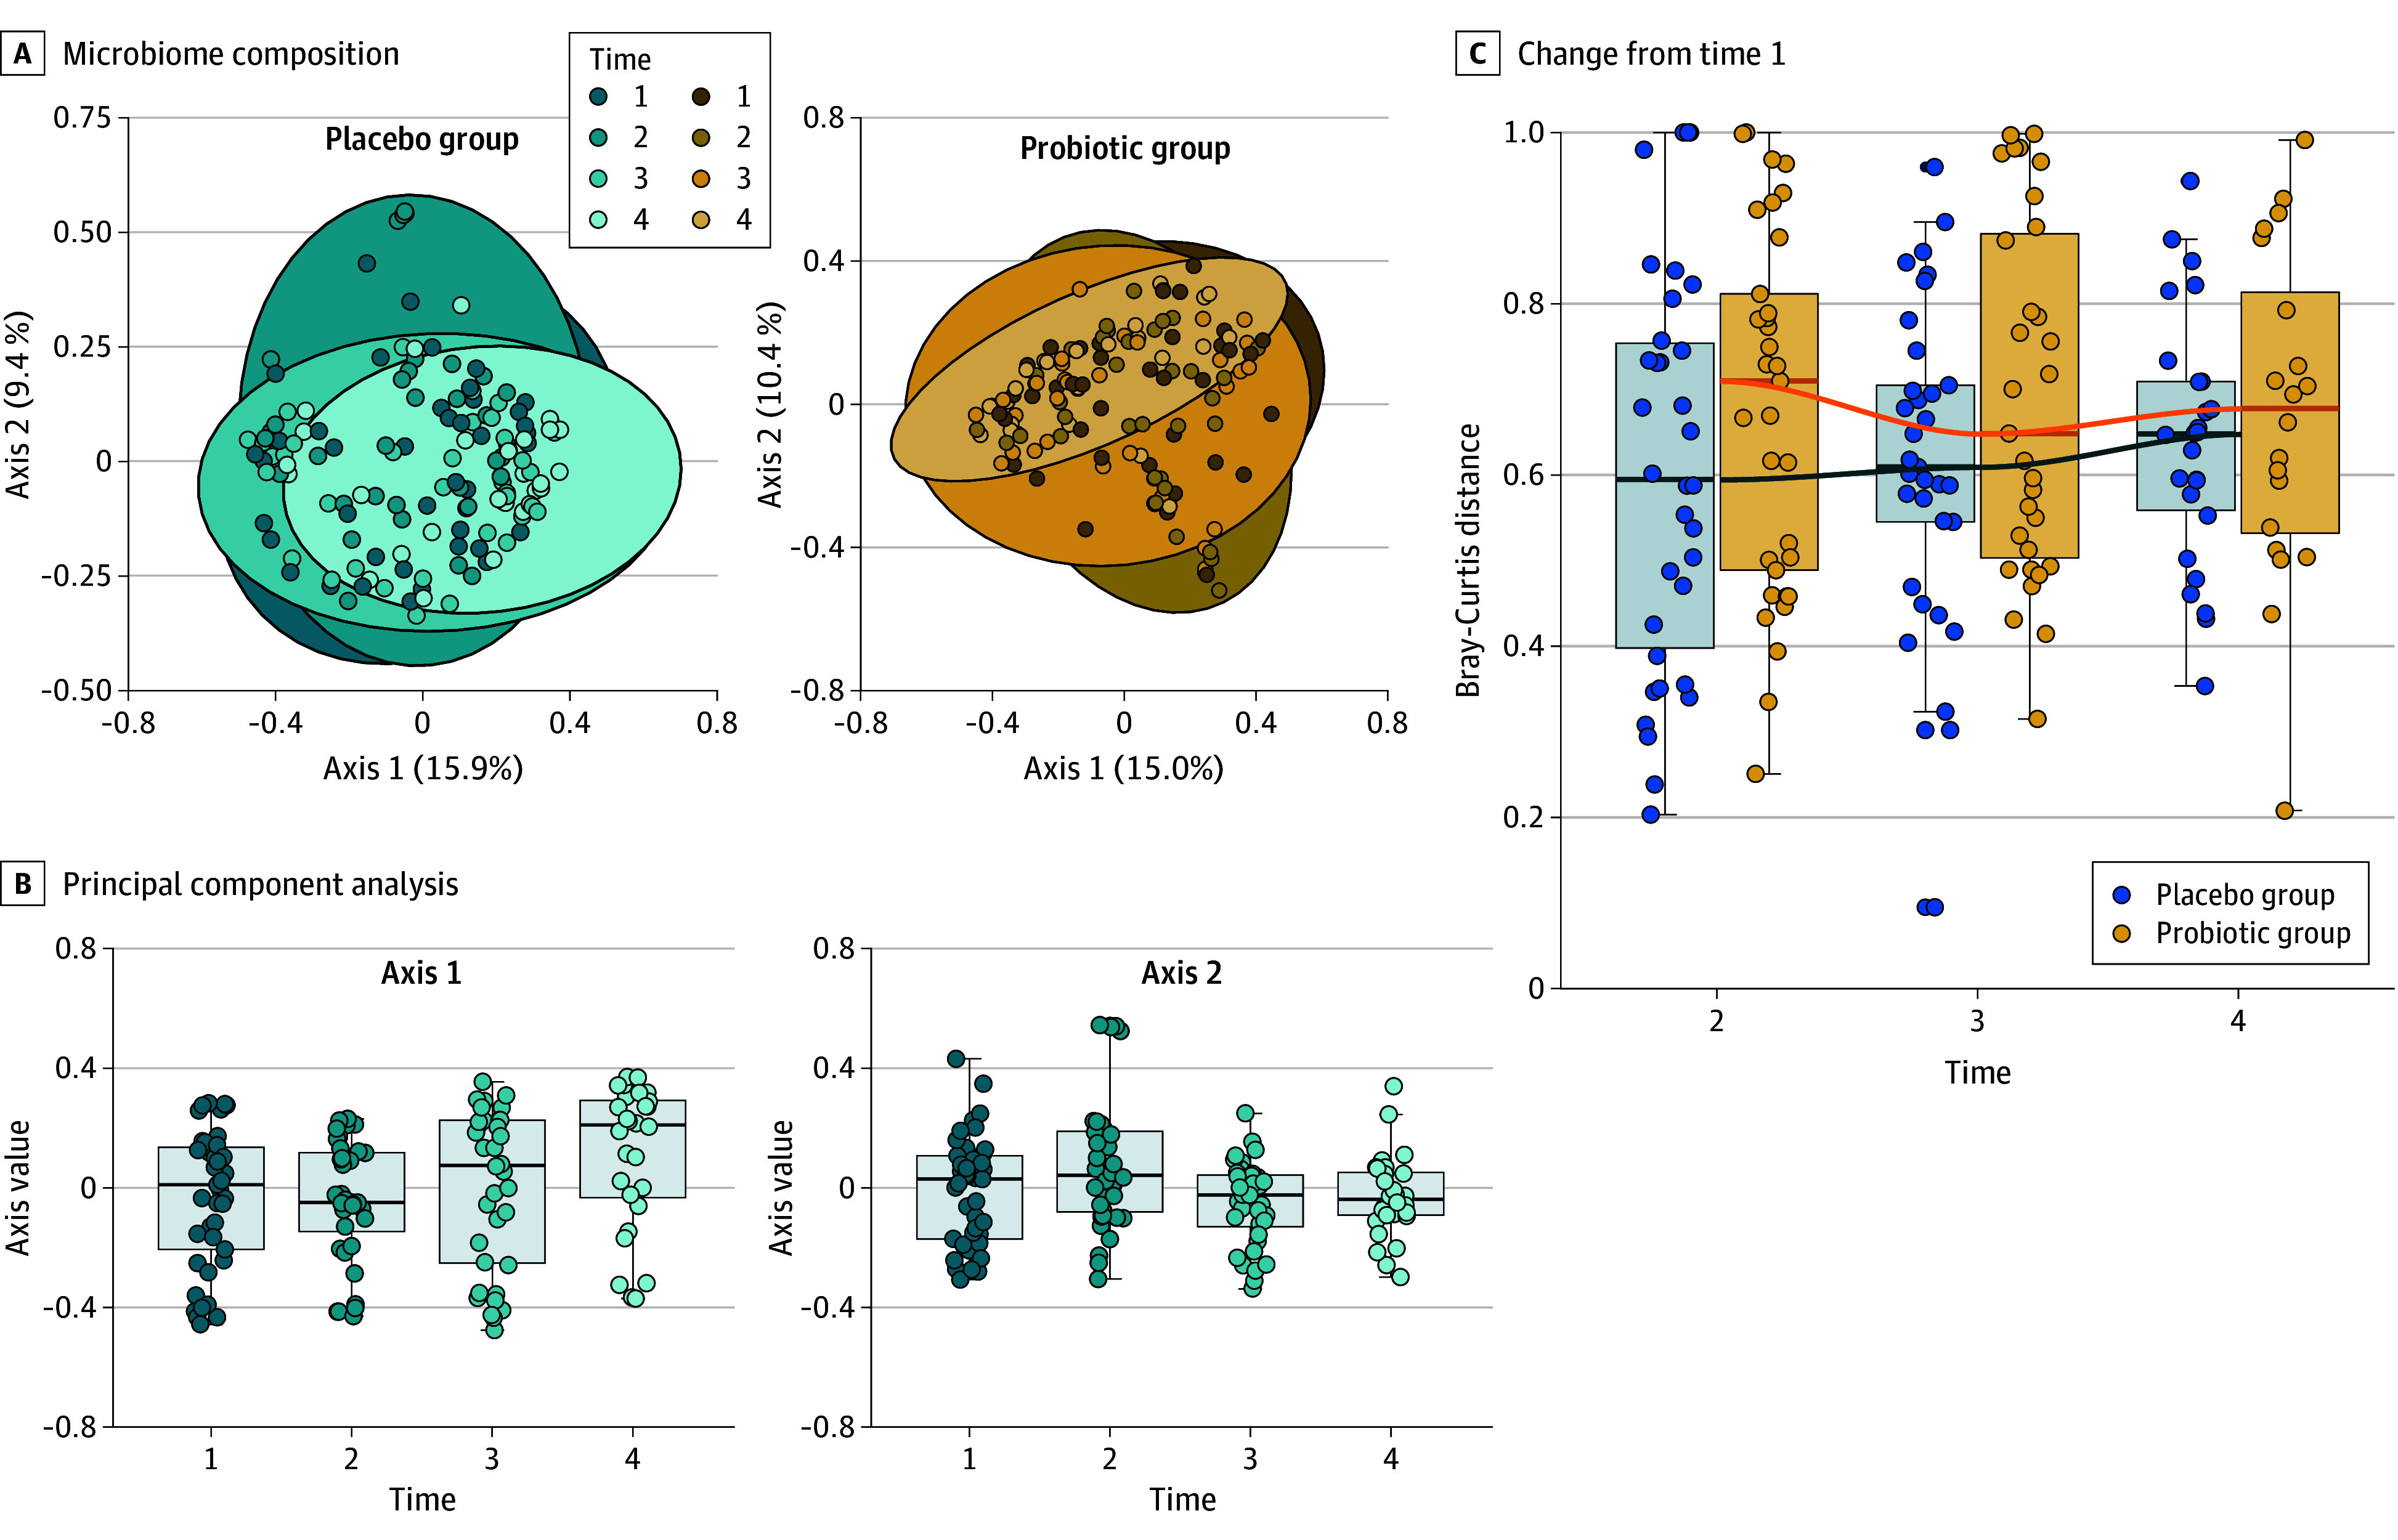
Figure 3. Beta Diversity.

A, Overall microbiome composition was associated with time in the placebo group (R2 = 1.76%; P = .004) but not in the probiotic group (P = .08). B, Samples from time 4 were significantly further from samples in times 1 (P = .001), 2 (P < .001), and 3 (P = .02) on the first axis in the placebo group. Samples from time 2 were significantly further from samples in times 1 (P = .04), 3 (P = .005), and 4 (P = .04) on the second axis in the placebo group. C, The dispersion of samples from each time point in the probiotic group was not equal, therefore the association of overall microbiome composition with time could not be assessed in this group (time effect P > .99 for the probiotic group and P = .70 for the placebo group; P = .53 for interaction in the probiotic group). Boxes indicate upper and lower quartiles; horizontal lines in boxes, median; and whiskers, minimum and maximum.
