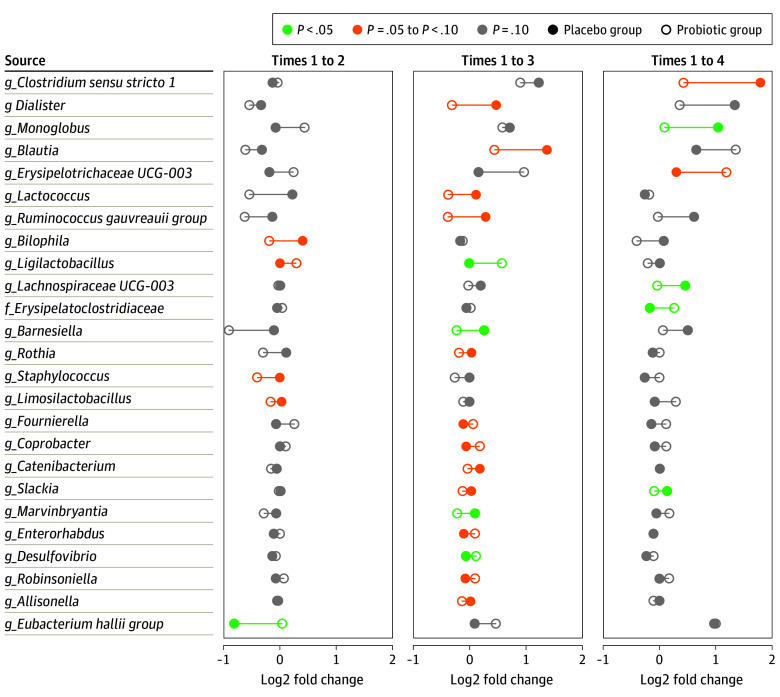
Figure 4. Log Fold Changes Compared With Time 1.
Differences between the placebo and probiotic groups in changes in relative abundance of taxa between times with P < .10. A point below 0 indicates a decrease compared with time 1, whereas a point above 0 indicates an increase compared with time 1. Lower case f indicates family; lower case g, genus.

