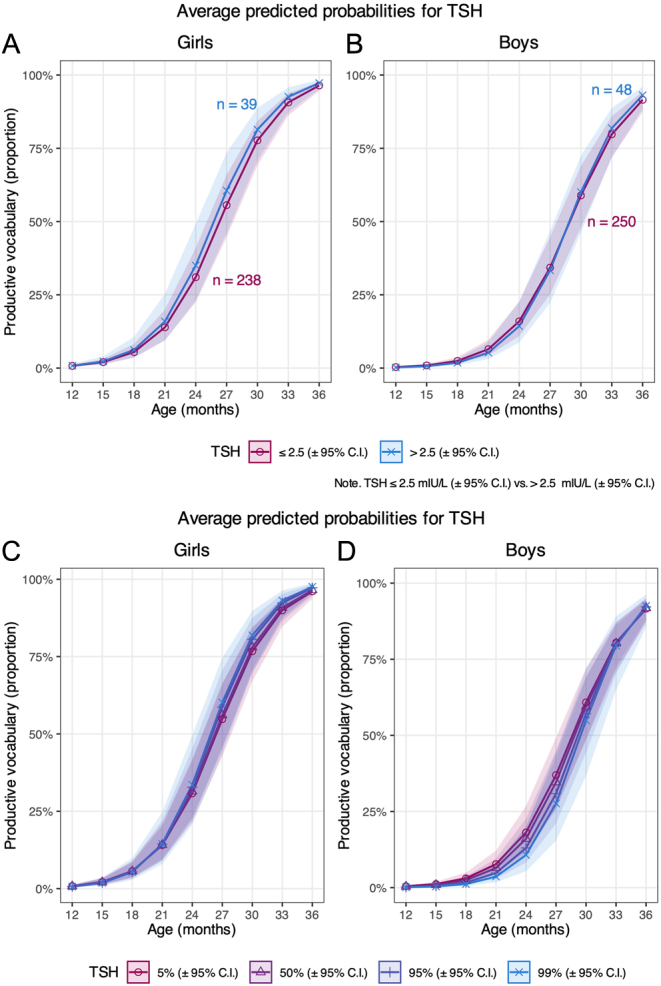
Figure 4.

Graphs (A) and (B) show the predicted probabilities of productive vocabulary according to maternal thyrotropin (TSH) ≤2.5 or >2.5 mIU/L and plotted by offspring age of girls and boys, respectively (model 5). Graphs (C) and (D) show the predicted probabilities of productive vocabulary at the 5th, 50thth, 95th, and 99th percentile of maternal TSH and plotted by offspring age of girls and boys, respectively (model 6). The lines represent the predicted mean trajectories with corresponding 95% CIs. Numbers in (A) and (B) represent complete cases included in the analyses of maternal TSH ≤2.5 or >2.5 mIU/L, respectively.

 This work is licensed under a