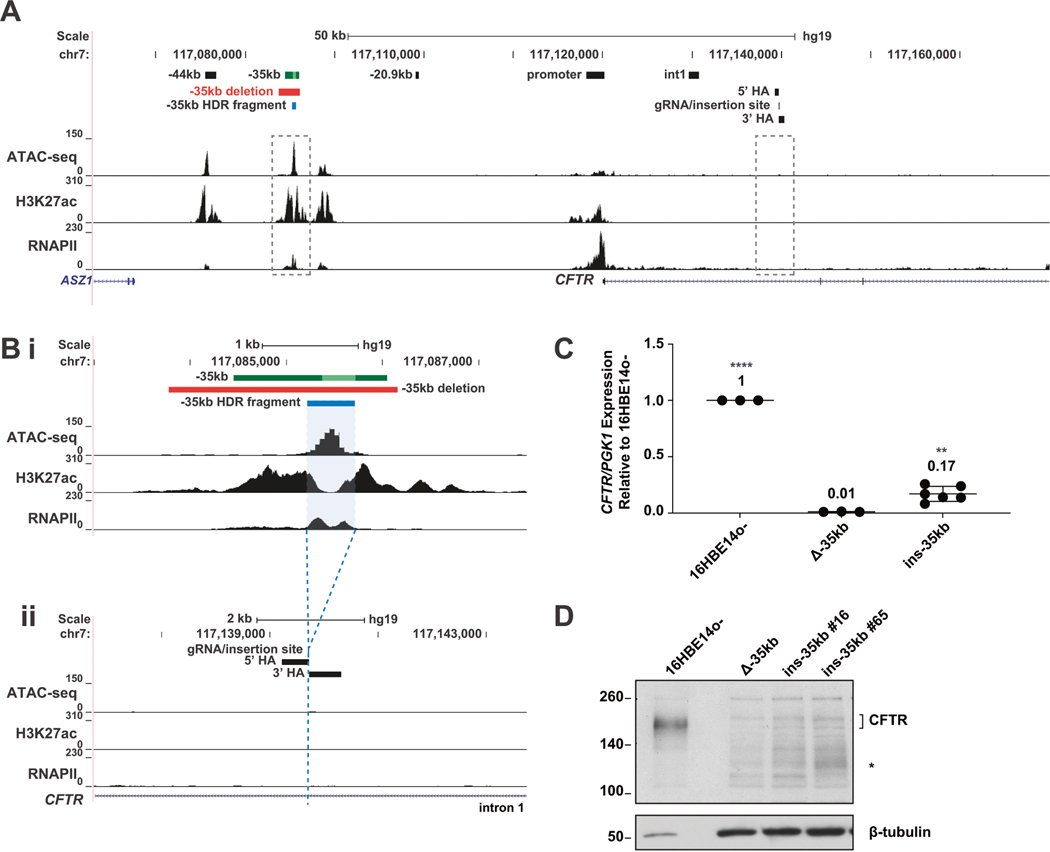
Fig. 1. Relocation of the −35 kb enhancer partially restores CFTR expression in 16HBE14o− cells.
A The genomic coordinates of the 5′ end of the CFTR locus are shown on hg19 at the top and below are open chromatin mapping (ATAC-seq), H3K27ac and RNAPII enrichment (ChIP-seq) in 16HBE14o− cells (ChIP-seq data from [21]). Magnified regions shown in panel (B) are boxed with dotted line. B Enlarged region of panel (A) detailing the −35 kb region (subpanel i), the −35 kb enhancer (dark green bar with 350 bp core enhancer [19] shown in lime green), the −35 kb enhancer deletion (red bar), and −35 kb fragment (blue bar) subsequently relocated to intron 1, with homology arms (HA) noted (subpanel ii). C CFTR mRNA expression normalized to PGK1, shown relative to 16HBE14o− WT cells (n = 3). Data for 2 Δ−35 kb ins i1 clones are pooled. **** denotes P < .0001 and ** denotes P < 0.01 compared to 16HBE14o− Δ−35kb cells using an unpaired t-test. D CFTR protein expression by western blot analysis, normalized to β-tubulin.

