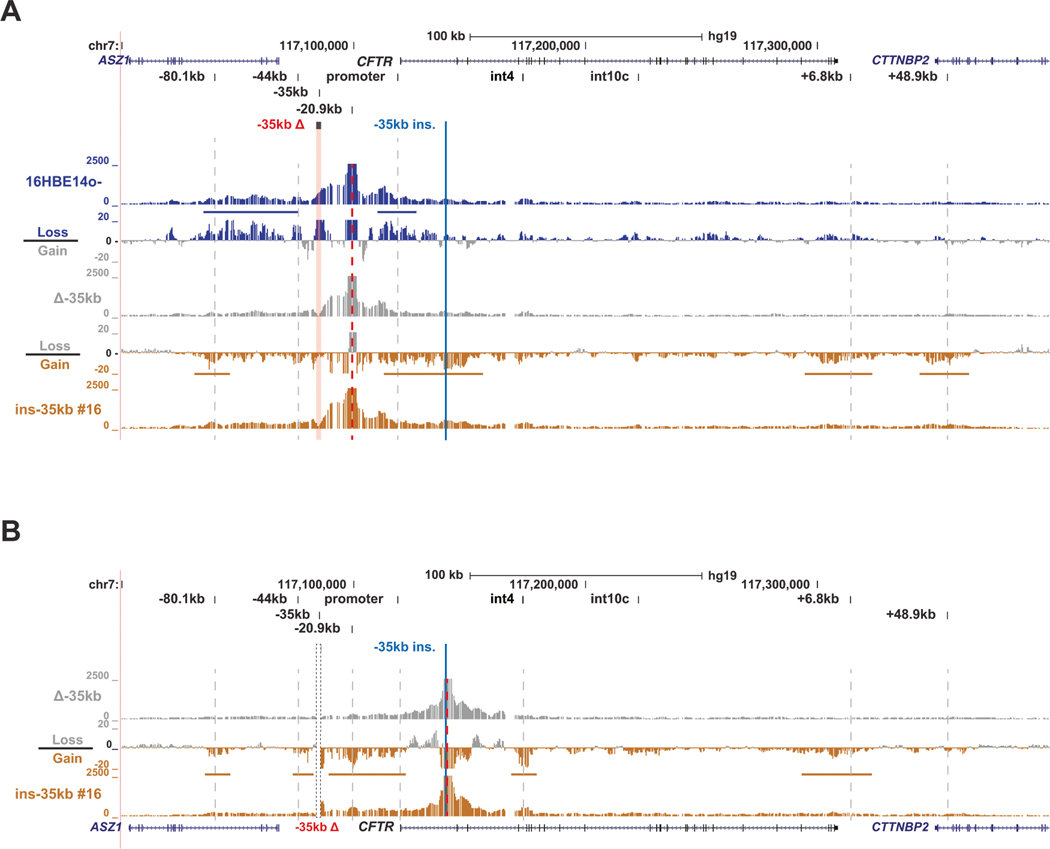
Fig. 3. The −35kb enhancer influences 3D structure of the CFTR locus independent of its location.
A 4C-seq quantification data shown for 16HBE14o– WT (blue), 16HBE14o– Δ−35 kb (grey) and 16HBE14o– ins-35 kb clone #16 (gold) cells with the −20.9 kb CRE as the viewpoint (red dotted line). At the top the hg19 genomic coordinates are shown. Key CFTR CREs are shown above the read quantification tracks of the 4C-seq interaction profiles. Between these tracks for each cell type are the corresponding subtraction tracks for each pair, in log2 scale, with colors indicating the cells from which losses or gains in interactions were measured. Horizontal colored bars denote key gains or losses discussed in the results. B 4C-seq data shown for 16HBE14o− Δ−35 kb (grey) and 16HBE14o− ins-35 kb clone #16 (gold) cells with a viewpoint adjacent to the intron 1 insertion site (red dotted line). Read quantification and subtraction tracks shown as in panel (A).

