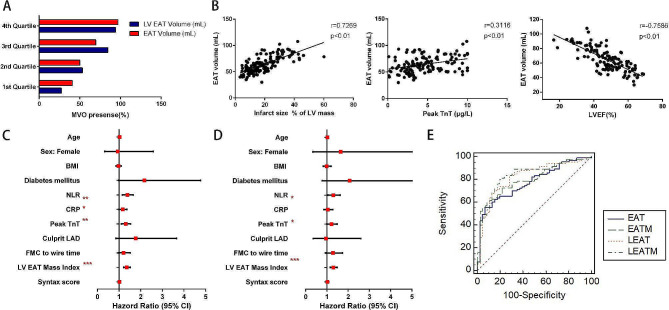
Fig. 2.
High EAT load was associated with MVO occurrence in STEMI patients. A Range distribution of MVO occurrence according to EAT and LV EAT volume. Bars represent the percentage of MVO occurrence identified at every quartile. B The association of EAT volume with infarct size, peak TnT and LVEF. C Univariate logistic regression analysis to identify the risk factors associated with the occurrence of MVO in patients with STEMI. D Multivariate logistic regression analysis to identify the risk factors associated with the occurrence of MVO in patients with STEMI. E Predictive accuracy of MVO based on ROC curve analysis. *P < 0.05, **P < 0.01, ***P < 0.001

