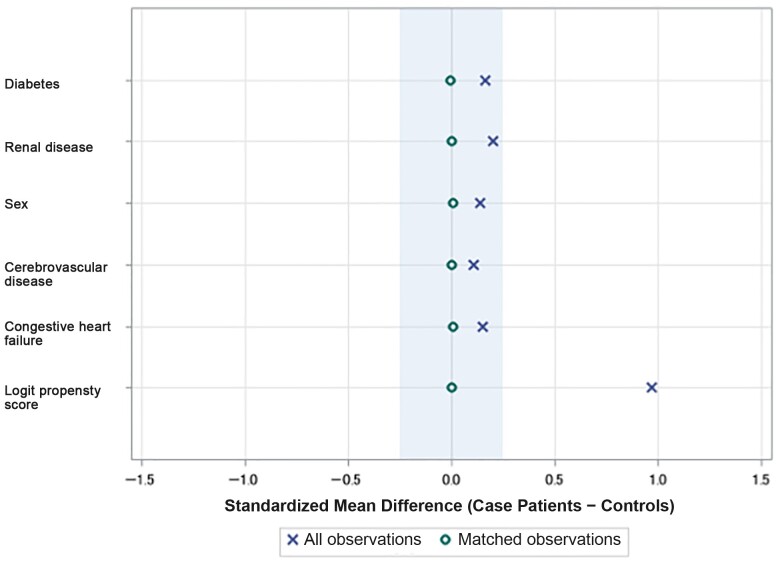
Figure 3.
Standardized mean differences between case patients (who received fecal microbiota transplantation) and controls (who did not) in the propensity-matched cohort, compared with all observations. Larger deviations for zero difference indicate difference in frequency of characteristics between case patients and controls. A difference of zero for matched observations indicates no difference in the frequency of each characteristic between case patients and matched controls.

