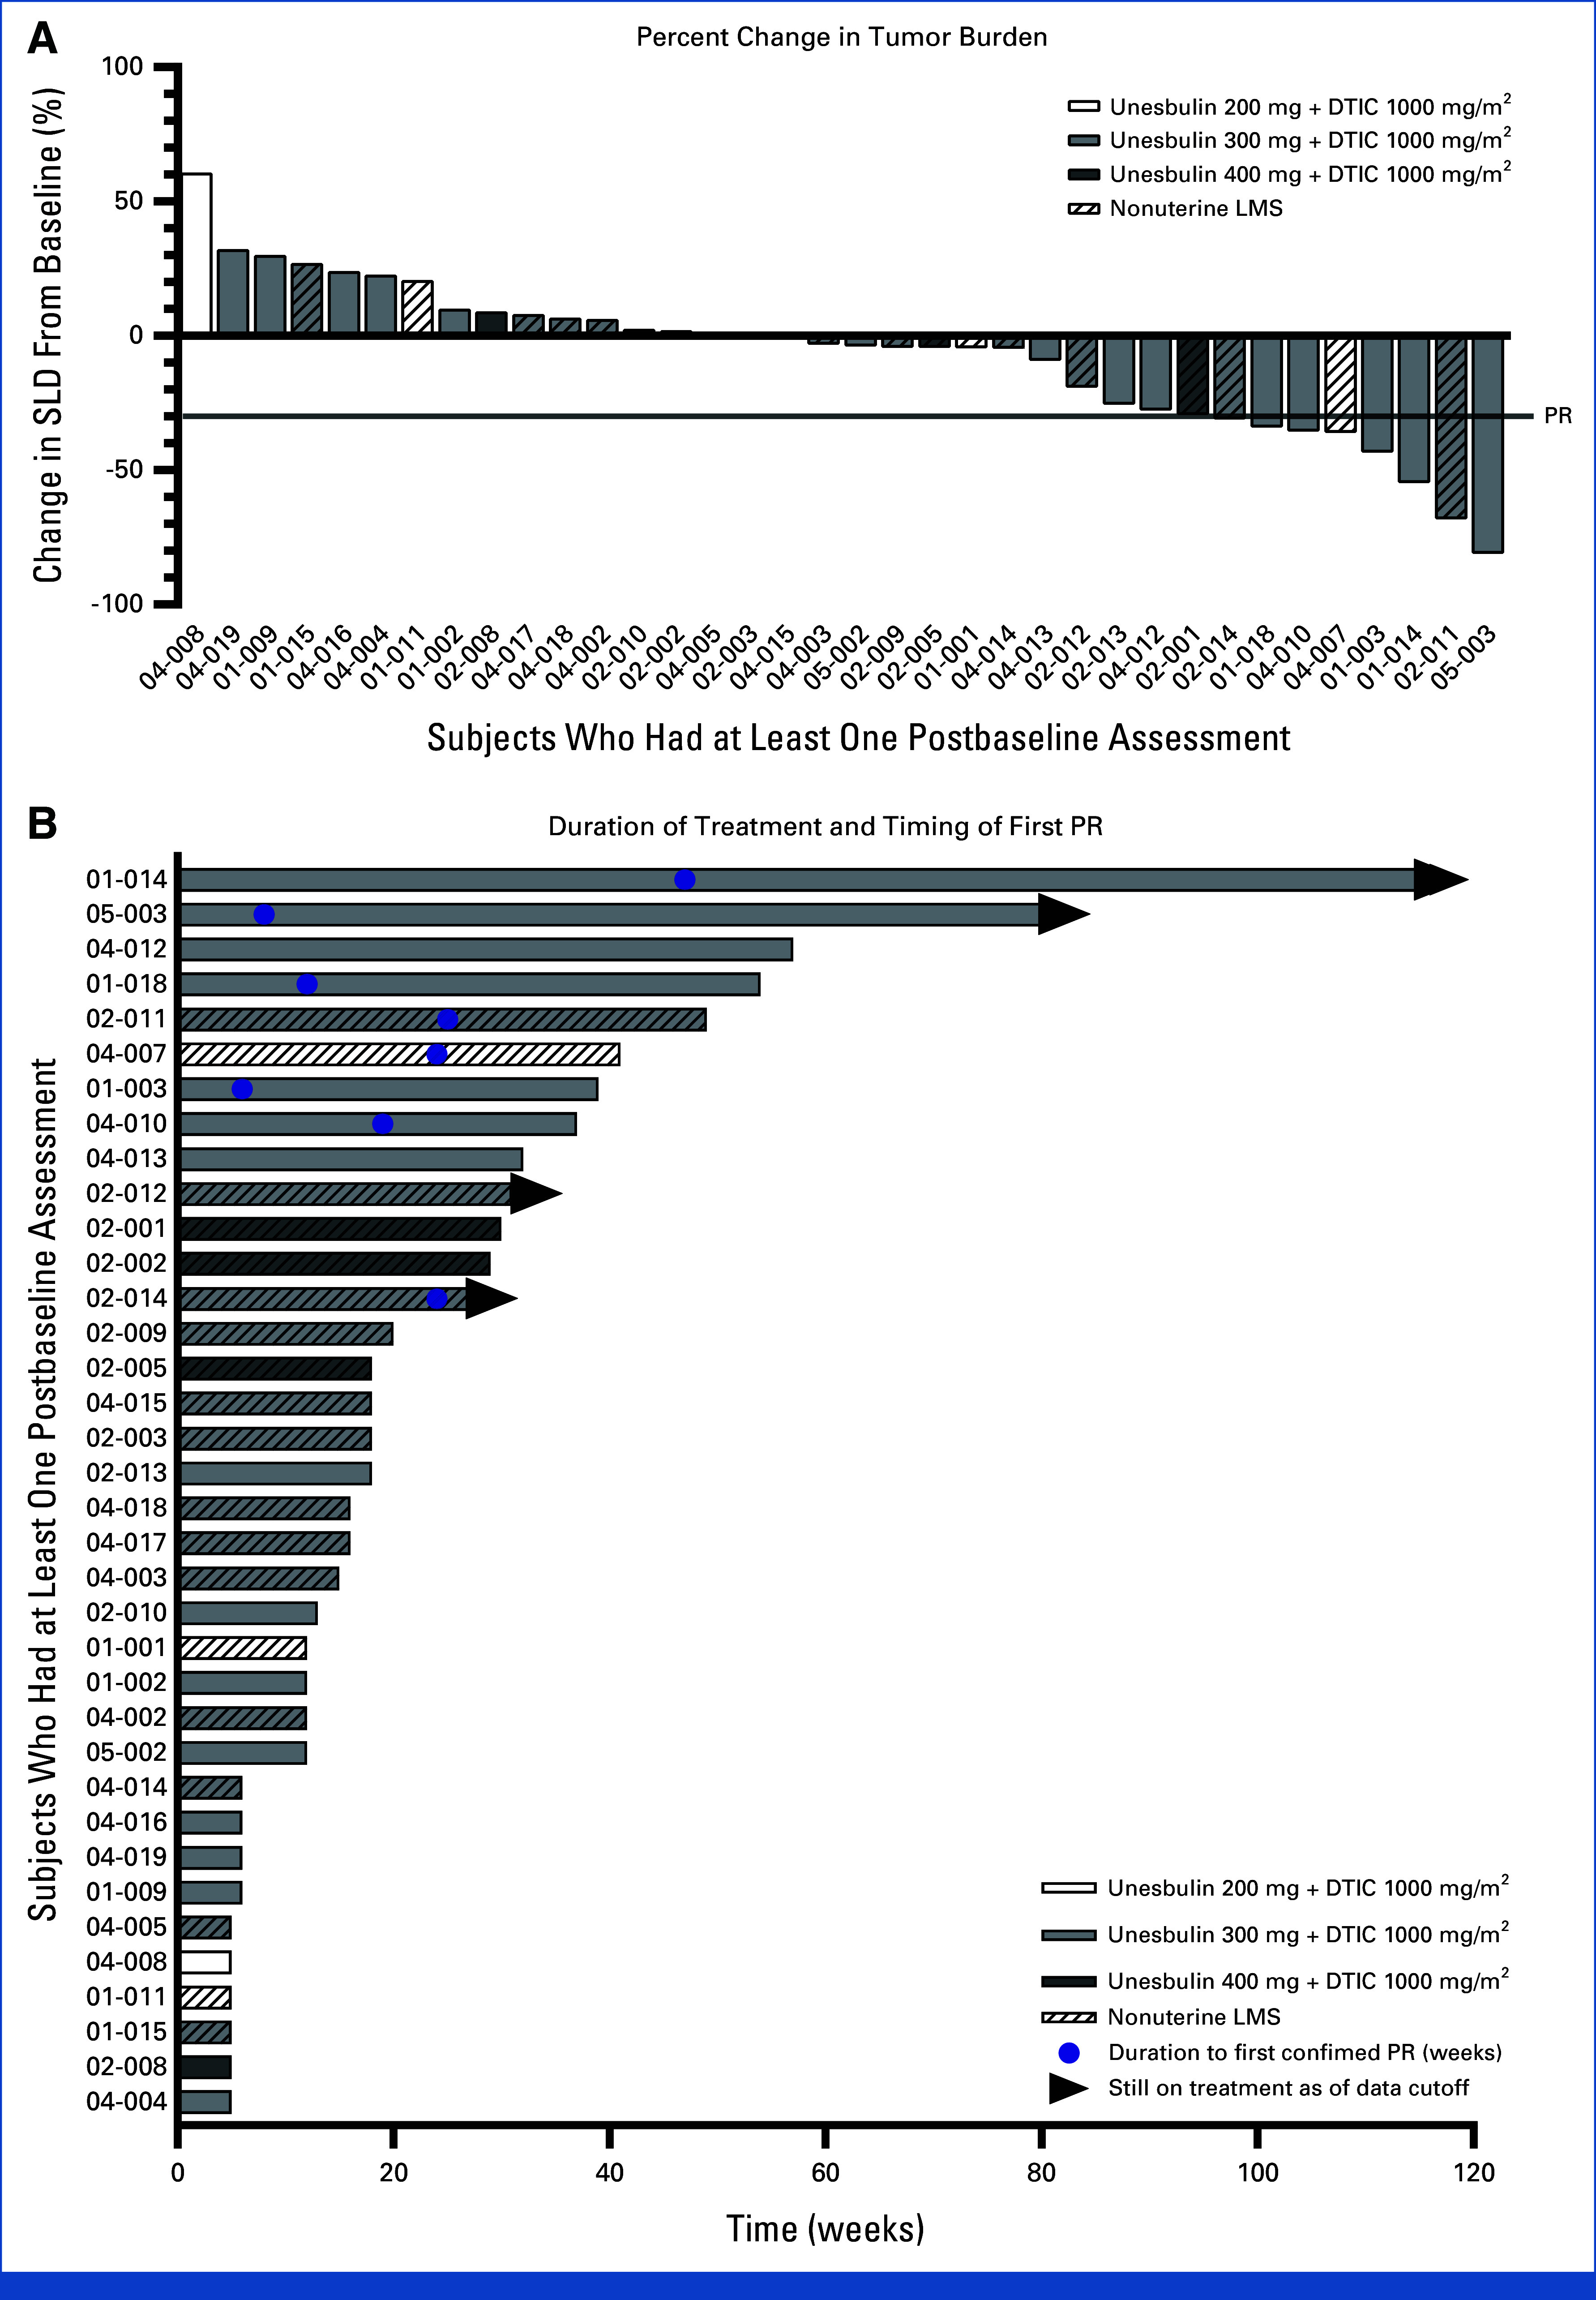
FIG 1.

Best tumor reduction and time on treatment by unesbulin (PTC596) dose level—efficacy population. (A) The waterfall plot is best tumor reduction from baseline in sum of diameters of all target lesions in the efficacy population. (B) Swimmer chart depicts time on treatment for the efficacy population. Among the 37 treated subjects, the following subject did not have a percent change of diameter noted: 01-010. Subjects with nonuterine LMS are designated with diagonal lines within the bars. Time on treatment (weeks) was measured as the time in weeks from the first dose date to the last dose date calculated as (last dose date – first dose date + 1). DTIC, dacarbazine; LMS, leiomyosarcoma; PR, partial response; SLD, sum of longest diameters.
