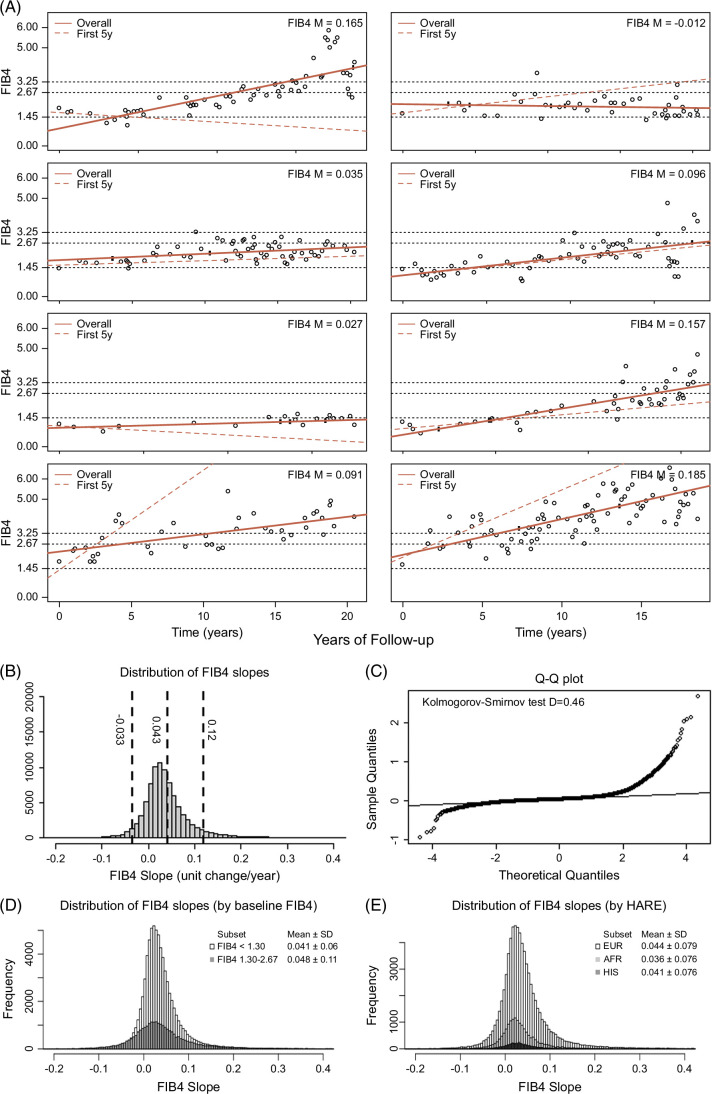
FIGURE 1.
FIB4 slopes evolve linearly in MASLD. (A) Representative dot plots of FIB4 values over years of clinical follow-up. Slope values derived from linear models are represented by a solid red line and reported in the top right. FIB4 slopes using only first 5 years of data are shown in the red dotted lines. (B) Distribution of FIB4 slope values. (C) QQ plot for distribution showing normality. (D) Distribution of FIB4 slopes by FIB4 baseline <1.3 or 1.3–2.67. (E) Distribution of FIB4 slope values by genetic ancestry. Abbreviations: FIB4, Fibrosis-4; MASLD, metabolic dysfunction–associated steatotic liver disease.

