
FIGURE 4.
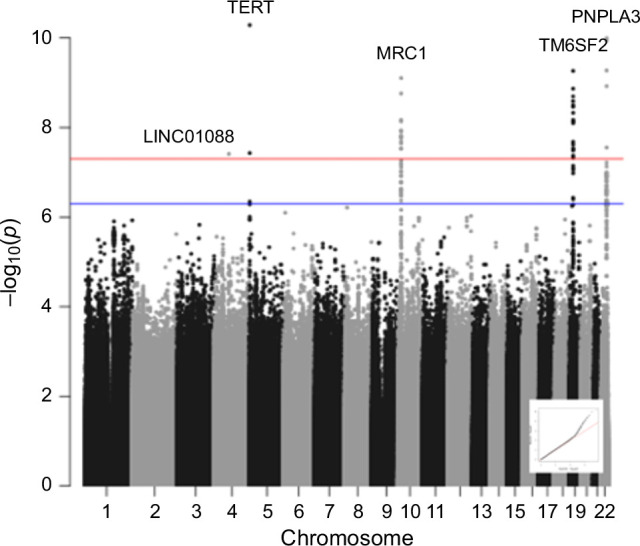
Manhattan plot for multiancestry GWAS meta-analysis of FIB4 slope in individuals with MASLD. Significant SNPs on chromosomes 4, 5, 10, 19, and 22 were observed at a threshold p value of 5 × 10⁻⁸. A QQ plot is embedded. Abbreviations: FIB4, Fibrosis-4; GWAS, genome-wide association study; MASLD, metabolic dysfunction–associated steatotic liver disease.