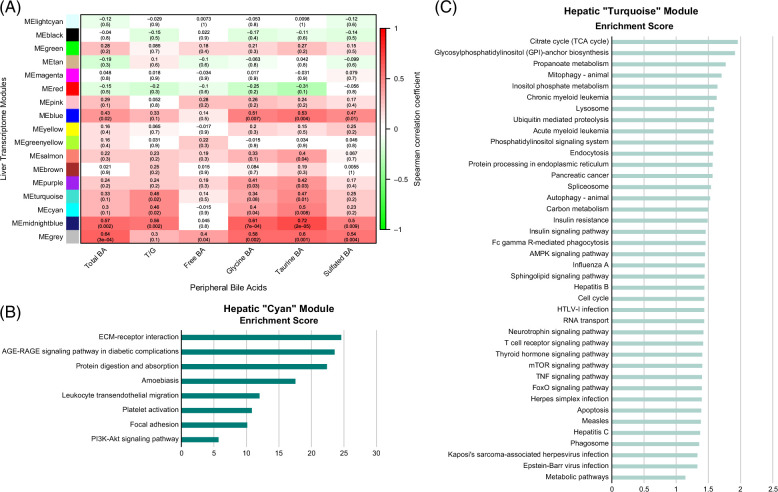
FIGURE 7.
Conjugated bile acids linked to hepatic pathways for inflammation and metabolism. (A) Correlation heatmap of serum grouped BA (x axis) in peripheral blood with hepatic coexpressed gene modules in HCVi (y axis). ME, module expression; upper row, Spearman correlation coefficient; parenthesis, 2-sided unadjusted p value. Hepatic coexpressed gene modules were constructed using WGCNA (Methods). Over-representation analysis of genes in hepatic modules (B) “MECyan” and (c) “METurquoise” visualized as bar plots. NetworkAnalyst, annotated to KEGG pathway database. Only visualized pathways with FDRp < 0.1. Abbreviations: BA, bile acid; FDR, false discovery rate; KEGG, Kyoto Encyclopedia of Genes and Genomes; WGCNA, weighted gene co-expression network analysis.

