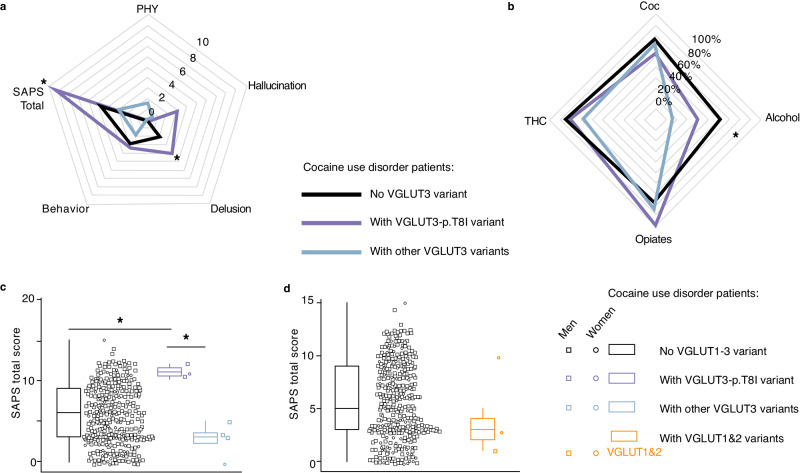
Fig. 1. Patients carrying the VGLUT3-p.T8I variant show increased clinical severity of cocaine use disorders.
Scores at the scale for the assessment of psychotic symptoms (SAPS). Total score is the sum of the delusion, hallucination, physical symptoms during cocaine craving (PHY) and behavioral subscales. Uncorrected p-values are shown. VGLUT1 gene, SLC17A7; VGLUT2 gene, SLC17A6; VGLUT3 gene, SLC17A8. a, SAPS scores as a function of p.T8I vs other VGLUT3 variant vs. no VGLUT3 mutation in patients with cocaine use disorder (Kruskal-Wallis chi-squared=8.16, df=2, two-sided, p = 0.0169 for total score and Kruskal-Wallis chi-squared=8.16, df=2, p = 0.035 for delusion subscale). N = 338 biologically independent samples. b, Frequency of substance use disorders (SUDs) (Coc, CUD; alcohol; opioids; cannabis, THC) as a function of p.T8I vs other VGLUT3 mutations vs no VGLUT3 mutation in the whole SUDs sample. The presence of p.T8I was not associated with increased prevalence of CUD but with decreased prevalence of alcohol use disorders (two-sided Fisher exact test, p = 0.03034). N = 338 biologically independent samples. c, SAPS total score as a function of VGLUT3 variants (none vs. p.T8I vs. others) in patients with CUD score significantly differed across the three genotypes groups (Kruskal-Wallis p = 0.0169). p.T8I carriers had significantly higher SAPS score compared to patients without VGLUT3 mutation (two-sided Wilcoxon test, p = 0.018), to those with other VGLUT3 mutations (two-sided Wilcoxon test, p = 0.018) and to those without any VGLUT mutation (two-sided Wilcoxon test, p = 0.048). N = 363 biologically independent samples. d, Total score at the SAPS as a function of VGLUT1 or VGLUT2 vs no VGLUT gene variants in CUD patients (two-sided Wilcoxon test =210, p = 0.92). N = 363 biologically independent samples. Source data are provided as a Source Data file. Boxplots are defined as follows (R program defaults), where IQR stands for interquartile range [Q3 (75th percentile value) - Q1 (25th percentile value)]: lower whisker = max(min(x), Q1 − 1.5 * IQR), lower bound of box =25th percentile, center of box =median, upper bound of box =75th percentile, upper whisker =min(max(x), Q3 + 1.5 * IQR). Lack of association with SAPS - delusion not shown for VGLUT3 and VGLUT1-2 variants (see Supplementary Fig. 1b).

