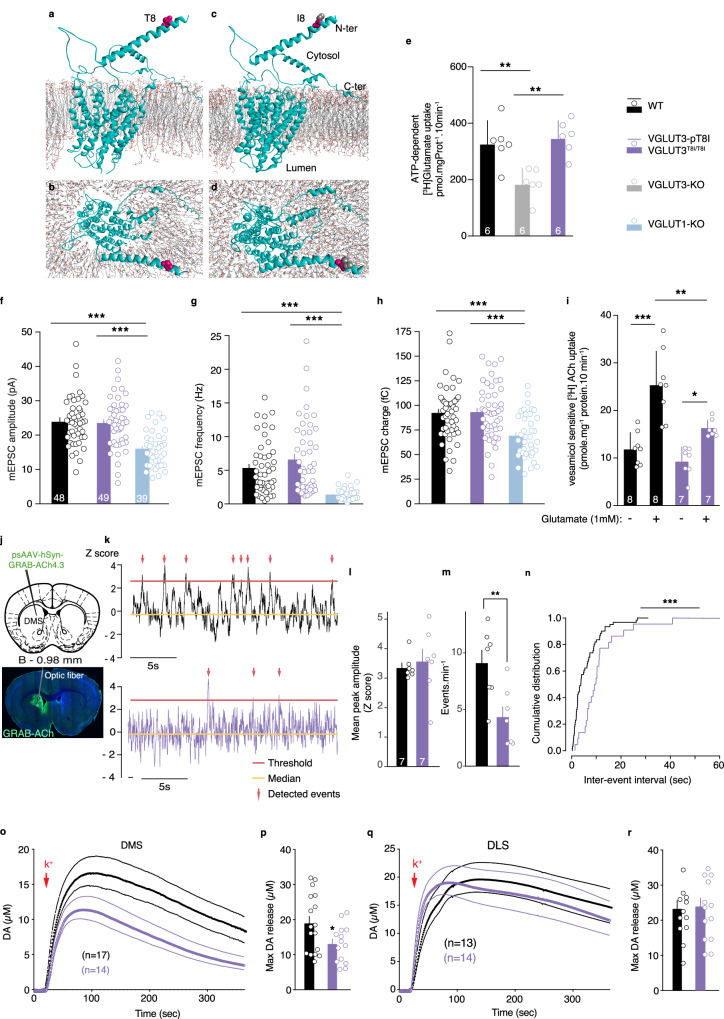
Fig. 3. The VGLUT3-p.T8I variant does not affect vesicular accumulation and release of glutamate but impairs ACh and DA signaling in the dorsal striatum.
a, Three-dimensional model of side and top view of VGLUT3 (a,b) and VGLUT3-p.T8I (c,d). e, Glutamate vesicular uptake in striatal vesicles from WT mice, VGLUT3T8I/T8I mice or VGLUT3-KO mice (for each genotype, n = 6 independent determinations). **p = 0.005 for WT mice vs VGLUT3-KO mice and **p = 0.002 WT mice vs VGLUT3T8I/T8I mice, one-way ANOVA, Tukey’s test post hoc analysis. f-h, Electrophysiological recordings of VGLUT1-KO autaptic neurons expressing VGLUT3 (WT) or VGLUT3-p.T8I. Plots of mean amplitude (f) frequency (g) or charge (h) of responses of autaptic neurons. ***p < 0.001 WT mice (n = 48 independent autapses recording) vs VGLUT3T8I/T8I mice (n = 49 independent autapses recording) vs VGLUT1-KO mice (n = 39 independent autapses recording), Kruskal-Wallis test; Dunn’s test post hoc analysis VGLUT3T8i/T8i mice vs VGLUT1-KO mice and WT mice vs VGLUT1-KO mice. i, Vesicular acetylcholine uptake measured in striatal synaptic vesicles, in absence (-) or presence (+) of glutamate (1 mM). ***p < 0.001 WT mice / Glu- vs WT mice / Glu + ; *p = 0.044 VGLUT3T8I/T8I mice / Glu- vs VGLUT3T8I/T8I mice / Glu + ; **p = 0.003 WT mice / Glu+ vs VGLUT3T8I/T8I mice / Glu + , (two-way ANOVA, Bonferroni’s test post hoc analysis) (Glu- n = 8 independent determinations, Glu + = n = 7 independent determinations). j, AAV-mediated delivery of GRAB-ACh4.3 sensor in DMS. k, Examples of fiber photometry recording (ΔF/F) for WT mice (black) or VGLUT3T8I/T8I mice (purple). l, m Mean peak amplitude and frequency of spontaneous ACh events (n = 7 WT mice and n = 7 VGLUT3T8I/T8I mice). **p = 0.009 (two-sided unpaired t-test) and Wilcoxon rank sum test with continuity correction (non-paired), W = 43.5, p = 0.017. n, Cumulative distribution of inter-event intervals. **p = 0.001 (two-sided Kolmogorov-Smirnov test). o-r, In vivo voltammetry of DA K+-evoked release in DMS (o) or DLS (q) of WT mice (black) and VGLUT3T8i/T8i mice (purple). (o) Genotype, F1,29 = 5.63, p = 0.024; time, F2.499, 72.46 = 39.76, p < 0.001; genotype x time, F399, 11571 = 1.84 p < 0.001 (two-way RM ANOVA, Bonferroni’s test post hoc analysis). Maximum level of DA release in DMS (p, n = 17 WT mice and n = 14 VGLUT3T8i/T8i mice), or DLS (r, n = 13 WT mice and n = 14 VGLUT3T8I/T8I mice). (p) *p = 0.03 (two-sided unpaired t-test). Data are presented as mean values ± SEM in e, f-i, l, m, p, r. Source data are provided as a Source Data file. Bar: 1000 µm in j.

