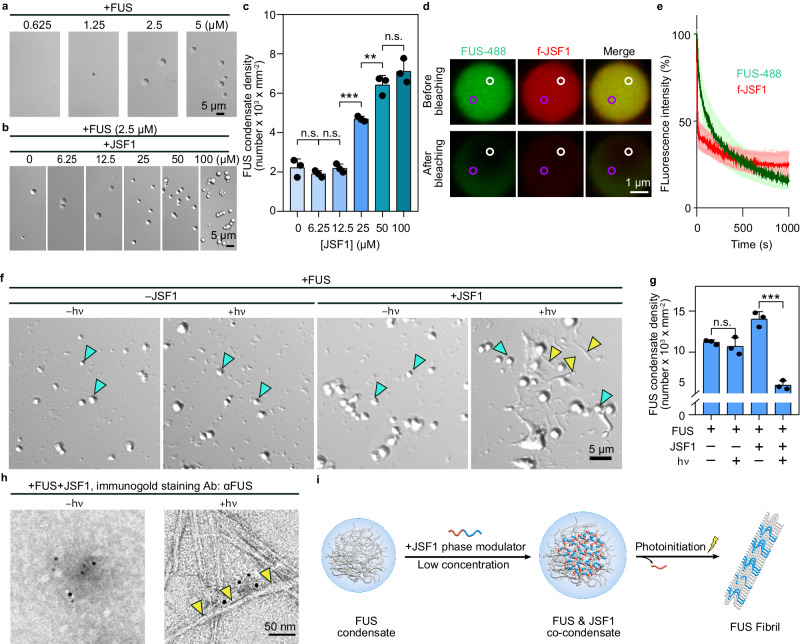
Fig. 3. JSF1 served as a phase modulator for FUS, promoting LLPS under dark conditions and triggering fibrilization upon photoinitiation.
a DIC images of FUS (0.625 − 5 µM). b DIC images of FUS (2.5 µM) with JSF1 (0 − 100 µM). c Condensate density of FUS (2.5 µM) with JSF1 (0–100 µM). Condensates within 0.01 mm2 were analyzed. The statistic results were quantified by ImageJ and shown as mean ± SD of 3 independent replicates (n = 3). Data were analyzed by one-way ANOVA using Tukey post-hoc test with a 95% confidence interval. **P < 0.01, ***P < 0.001, n.s. non-significant. 0 µM vs 6.25 µM: P = 0.9074, q = 1.422, DF = 12. 6.25 µM vs 12.5 µM: P = 0.9354, q = 1.293, DF = 12. 12.5 µM vs 25 µM:P < 0.0001, q = 11.25, DF = 12. 25 µM vs 50 µM: P = 0.0015, q = 7.757, DF = 12. 50 µM vs 100 µM: P = 0.3073, q = 3.103, DF = 12. d FLIP representative images of FUS (2.5 µM, FUS-488:FUS = 1:9) and JSF1 (2.5 µM, f-JSF1:JSF1 = 1:19) co-condensate. White circle: bleached zone. Purple circle: region of interest (ROI). e FLIP traces of the co-condensates. Data were shown as mean ± SD (n = 5). f DIC images of FUS incubated in the presence or absence of JSF1 with or without photoinitiation for 48 h. Blue arrow: condensate. Yellow arrow: fibril-like aggregate. g Condensate density of the samples in (f). The statistic results were quantified by ImageJ and shown as mean ± SD of 3 independent replicates (n = 3). Data were analyzed by one-way ANOVA using Tukey post-hoc test with a 95% confidence interval. ***P < 0.001, n.s. non-significant. –JSF1–hν vs –JSF1+hν: P = 0.8330, q = 1.192, DF = 8. –JSF1–hν vs –JSF1+hν: P < 0.0001, q = 18.54, DF = 8. h TEM images with immunogold labeling of FUS incubated with JSF1 with or without photoinitiation at 48 hours. Antibody: αFUS. Yellow arrow: fibril. i Schematic illustration of the impacts of low concentration JSF1 on FUS condensates. Source data are provided as a Source Data file.

