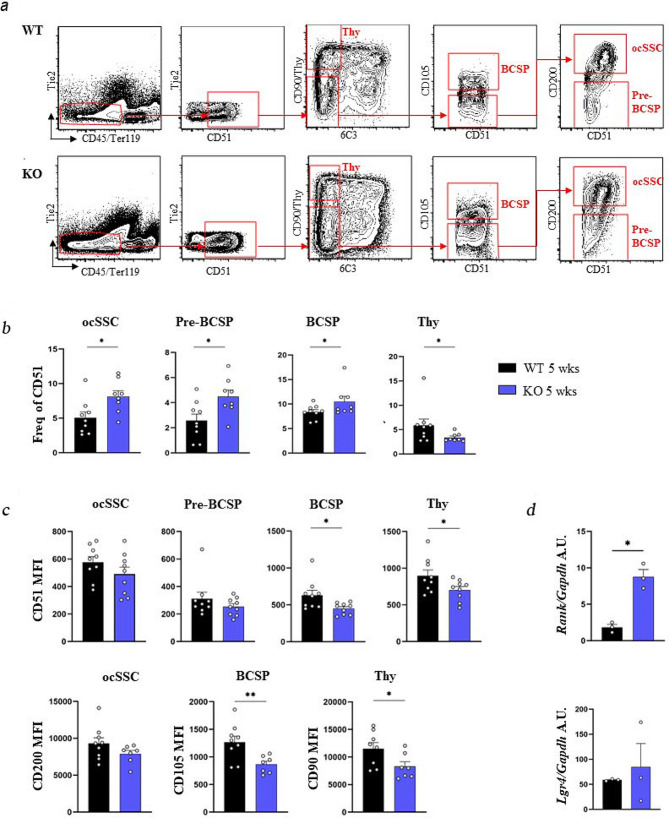
Fig. 1.
FACS sorting and characterization of osteochondral SSC (ocSSCs) and downstream progenitors in WT and Rankl−/− mice. a Representative contour plots of the gating strategy for both genotypes. b Abundance of the different ocSSPC populations, expressed as frequency of CD51+ cells, in 5-week-old mice of both genotypes. c Expression level of the positive markers in the indicated cell populations, expressed as mean fluorescence intensity (MFI). d Gene expression level of the RANKL receptors Rank and Lgr4 in FACS-sorted ocSSCs, normalized on Gapdh and expressed as Arbitrary Units (A.U.). All the data are expressed as mean ± SEM. * p < 0.05, ** p < 0.01; Mann-Whitney test. KO: knockout, Rankl−/−

