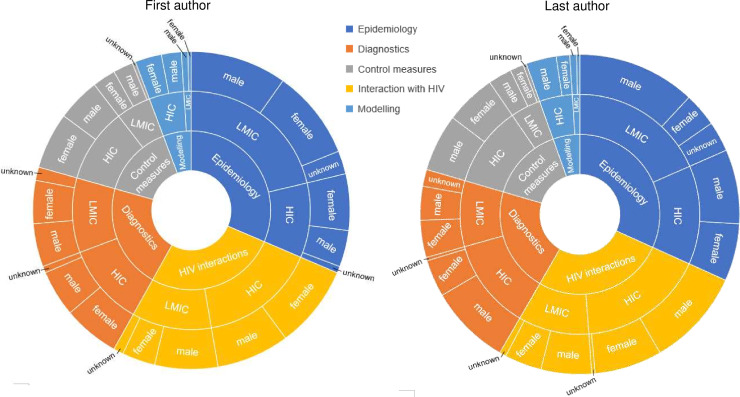
Figure 2.
Sunburst diagrams displaying the relative proportions of geographical affiliation and gender of first and last authors. The innermost layer illustrates the proportions of included studies from each research area; the middle layer illustrates the proportions of first (left hand side) and last (right hand side) authors from LMIC and HIC for each research area; and the outermost layer illustrates the gender proportions for each respective group of authors.

