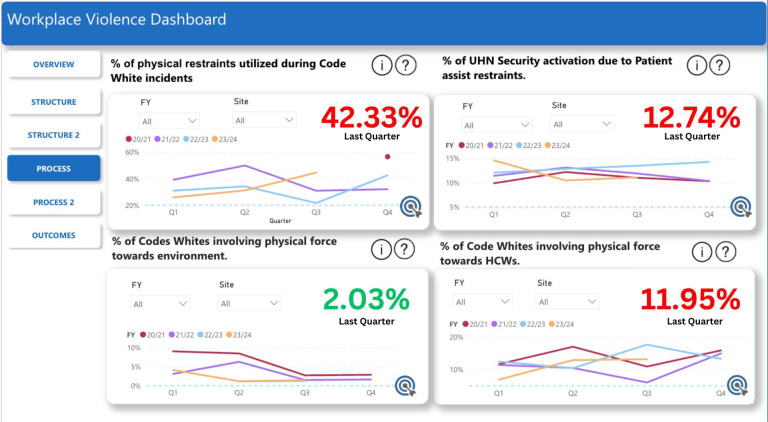
Figure 4.
The UHN workplace violence dashboard. This is an example of a WPV dashboard, all numbers and figure are hypothetical and solely intended to visually demonstrate the utilisation of a dashboard and does not represent real-world data from UHN. The numbers in green reflect values that meet the organisation’s target while the numbers in red indicate values that are below the organisation’s target. UHN, University Health Network; WPV, workplace violence.

