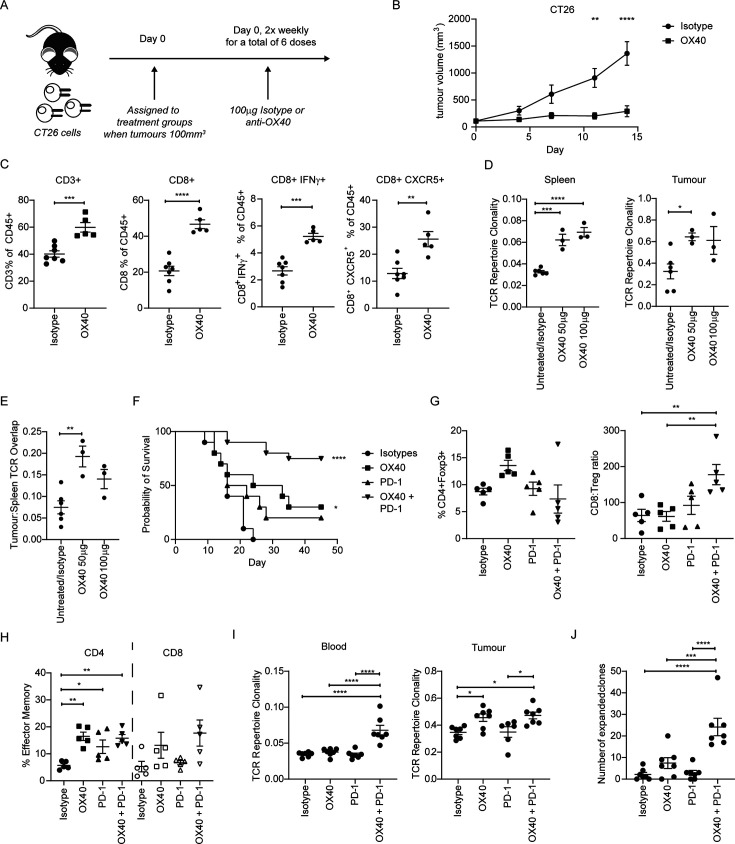
Figure 1.
anti-mOX40 rIgG1 mAb results in an activated immune response in CT26 syngeneic tumor models. (A) Schematic of mice challenged with 5×10⁵ CT26 tumor cells and subsequent treatment with either isotype control or anti-mOX40 (OX86) mAb (100 µg) two times per week. (B) Growth curves of mice challenged with CT26 cells and treated as depicted in A; n=10 (similar trends observed in multiple studies). (C) Mice inoculated with 5×10⁵ CT26 tumor cells were harvested 10 days post initial treatment with TILs assessed by flow cytometry for CD45+CD3+ (left panel), CD8+ (left middle panel), CD8+IFN-γ+ (right middle panel) and CD8+CXCR5+ (right panel). N=7 isotype control and n=5 for anti-mOX40, one experiment. (D) Mice inoculated with 5×10⁵ CT26 tumor cells 7 days post treatment with indicated doses of anti-OX40. Spleens (left panel) and tumor (right panel) were harvested and assessed for TCR repertoire clonality; n=3 except the combined group of isotype and untreated where n=6, one experiment. (E) Analysis of the overlap of TCR CDR3 clones between spleen and tumor analyzed in D; n=3 except the combined group of isotype and untreated where n=6, one experiment. (F) Survival curves of mice challenged with 5×10⁵ CT26 SC and treated with either anti-mOX40 (100 µg), anti PD-1 (200 µg) or combination of anti-mOX40 and anti-PD-1 dosed as outlined in A. n=10 for isotype, anti-mOX40 and anti-PD-1, n=20 for anti-mOX40+anti-PD-1. Similar trends were observed in multiple studies. (G–H) TILs harvested on day 10 and immunophenotyped for Treg (G—left panel), CD8:Treg ratio (G right panel) and effector memory cells (CD62L low CD44 high) (H). n=5, one experiment. (I) TCR repertoire clonality analysis for blood (left panel) and tumor (right panel) from CT26-bearing mice harvested on day 15; n=7, except for tumor sample treated with anti-PD-1 where n=6, one experiment. (J) Analysis of the overlap of TCR CDR3 clones between blood and tumor. N=7, one experiment ****p<0.0001, ***p<0.001, **p<001, *p<0.05 mean±SEM B. Sidak’s multiple comparison one-way ANOVA, C and E—unpaired t-test, D–E—Dunnet’s multiple comparison one-way ANOVA, F—log-rank test, G–J—Tukey’s multiple comparison one-way ANOVA. ANOVA, analysis of variance; mAb, monoclonal antibody; PD-1, programmed cell death protein-1; TCR, T-cell receptor; TIL, tumor-infiltrating lymphocyte; Treg, regulatory T cells.

