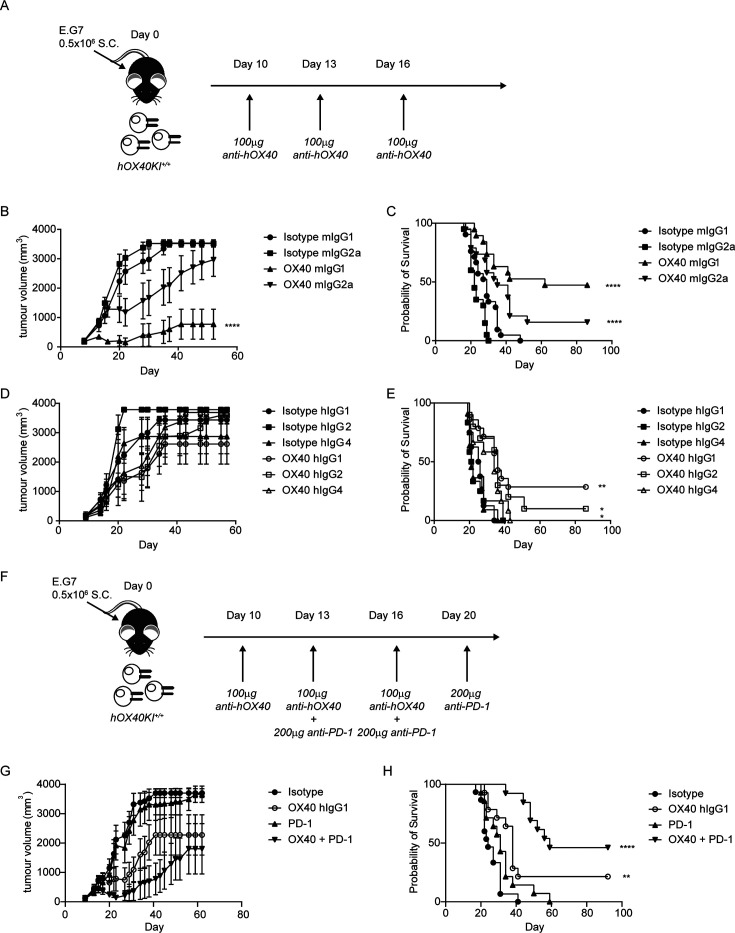
Figure 5.
Combination of anti-hOX40 and anti-PD-1 is more efficacious than monotherapy. (A) Schematic of treatment regime used in B–D. (B) Growth curves of hOX40KIhom mice inoculated with 0.5×10⁶ E.G7-OVA S.C. and then treated with 100 µg anti-hOX40 mIgG1 or mIgG2a or respective isotype controls on day 10, 13, 16. N=9 representative of three independent experiments. (C) Survival graph of hOX40KIhom mice challenged as in B. Isotype mIgG1 n=21, isotype mIgG2a n=20, anti-hOX40 mIgG1 n=19 and anti-hOX40 mIgG2a n=19 pooled from three independent experiments. (D) Growth curves of hOX40KIhom mice inoculated with 0.5×10⁶ E.G7-OVA S.C. and then treated with 100 µg anti-hOX40 hIgG1, hIgG2 or hIgG4 or respective isotype controls on day 10, 13, 16. Isotype hIgG1 n=4, isotype hIgG2 n=7, isotype hIgG4 n=6, anti-hOX40 hIgG1 n=7, anti-hOX40 hIgG2 n=5 and anti-hOX40 hIgG4 n=6, representative of two independent experiments. (E) Survival graph of hOX40KIhom mice challenged as in D. Isotype hIgG1 n=8, isotype hIgG2 n=12, isotype hIgG4 n=11, anti-hOX40 hIgG1 n=14, anti-hOX40 hIgG2 n=10 and anti-hOX40 hIgG4 n=12 pooled from two independent experiments. (F) Schematic of E.G7-OVA tumors treated with anti-OX40 and anti-PD-1. (G) Growth curves of hOX40KIhom mice inoculated with 0.5×10⁶ E.G7-OVA S.C. and then treated as detailed in F. Isotype combination n=8, anti-hOX40 hIgG1 n=8, anti-PD-1 rIgG2a n=8 and anti-hOX40 hIgG1+anti-PD-1 rIgG2a n=7, representative of two independent experiments. (H) Survival plots of hOX40KI mice challenged as in F. Isotype combination n=15, anti-hOX40 hIgG1 n=14, anti-PD-1 rIgG2a n=14 and OX40 hIgG1+anti-PD-1 rIgG2a n=13. ****p<0.0001, **p<0.01, *p<0.05 mean±SEM B—Sidak’s multiple comparison one-way analysis of variance on day 52 related to isotype control, C, E and H—log-rank test. KI, knock-in; OVA, ovalbumin; PD-1, programmed cell death protein-1.

