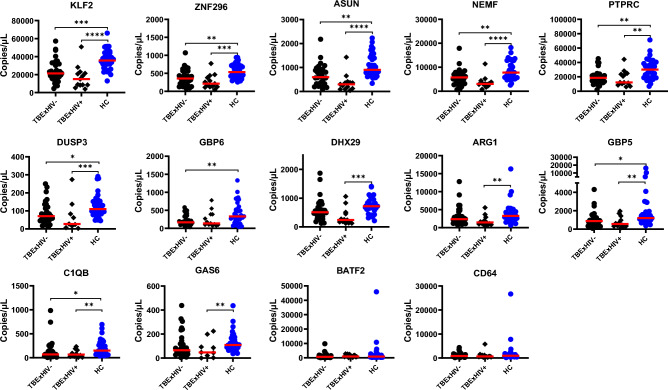
Figure 3.
TB exposure is associated with a downregulated pattern of expression profiles. Scatter plots of median show that irrespective of IGRA status and HIV status, TB exposure (black dots) affects gene expression compared to no known history of TB exposure–HC individuals (blue dots). TBExHIV- included 19 LTBI and 13 TBExIGRA- participants while TBExHIV + included 5 LTBI and 8 TBExIGRA- participants. Statistical comparison was performed using Kruskal–Wallis test and Dunn's Test with Bonferroni corrected p-values for multiple comparisons. *Denotes p < 0.05, **denotes p < 0.01, ***denotes p < 0.001 and ****denotes p < 0.0001.

