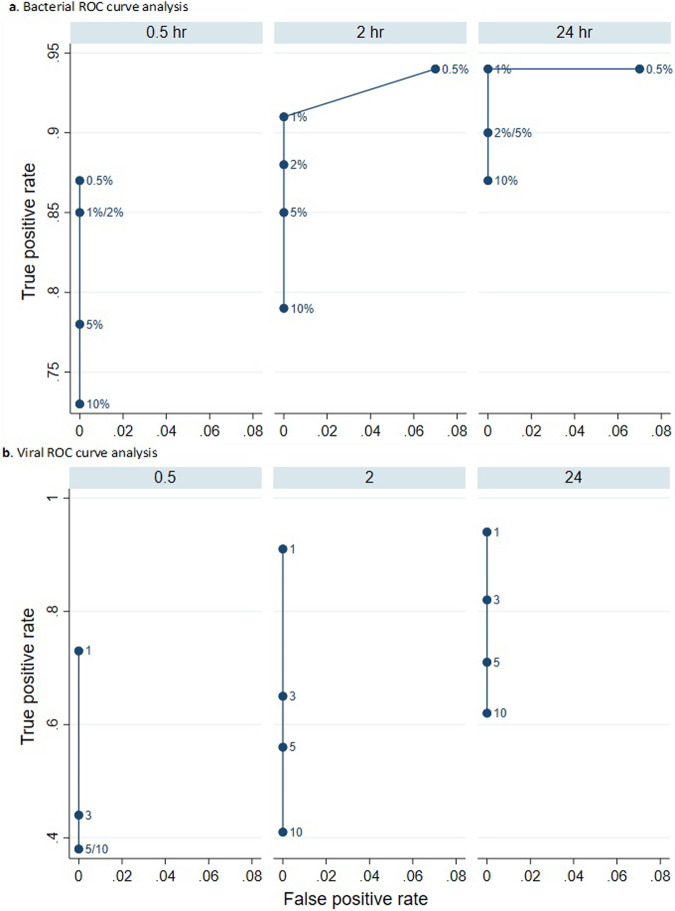
Fig. 2. Bacterial and Viral ROC curve analysis.
a ROC curves were constructed to establish the bacterial and viral reporting thresholds. True positive rate (sensitivity) against the false positive rate (1-specificity) for bacterial detection at different bacterial abundance thresholds (0.5%, 1%, 2%, 5%, and 10%) after 0.5 h, 2 h, and 24 h of sequencing. The y-axis represents the true positive rate, indicating how the metagenomics method detects actual cases of bacterial presence as confirmed by standard culture and molecular assays. The x-axis represents the false positive rate, reflecting the proportion of false positives among the negatives identified by the clinical assays. b This ROC curve focuses on viral read counts (1, 3, 5, and 10) after 0.5 h, 2 h, and 24 h of sequencing. Again, the y-axis shows the true positive rate, measuring how accurately the metagenomics detects viruses relative to a standard multiplex PCR assay. The x-axis shows the false positive rate. Points represent thresholds for the number of viral reads necessary to report a positive result.

