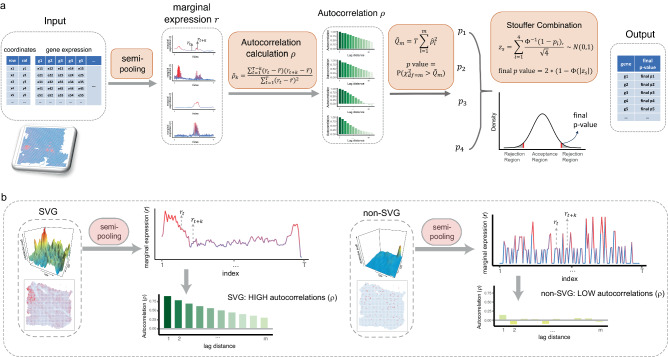
Fig. 1. Schematic representation of the HEARTSVG.
a HEARTSVG utilizes the semi-pooling process to convert spatial gene expressions into marginal expressions () and calculates autocorrelations () of marginal expressions. HEARTSVG calculates the sum of the squared autocorrelations () for each marginal expression series and obtains a p-value by testing . All these p-values are combined into a final p-value through the Stouffer combination (, final ). HEARTSVG distinguishes between SVGs and non-SVGs by the final p-value. b The autocorrelations () of marginal expressions () for the SVG and non-SVG exhibit different level scales. Representative autocorrelation estimator plots are plotted below the corresponding marginal expression plots for the SVG and non-SVG. The color depth represents the magnitude of autocorrelation.

