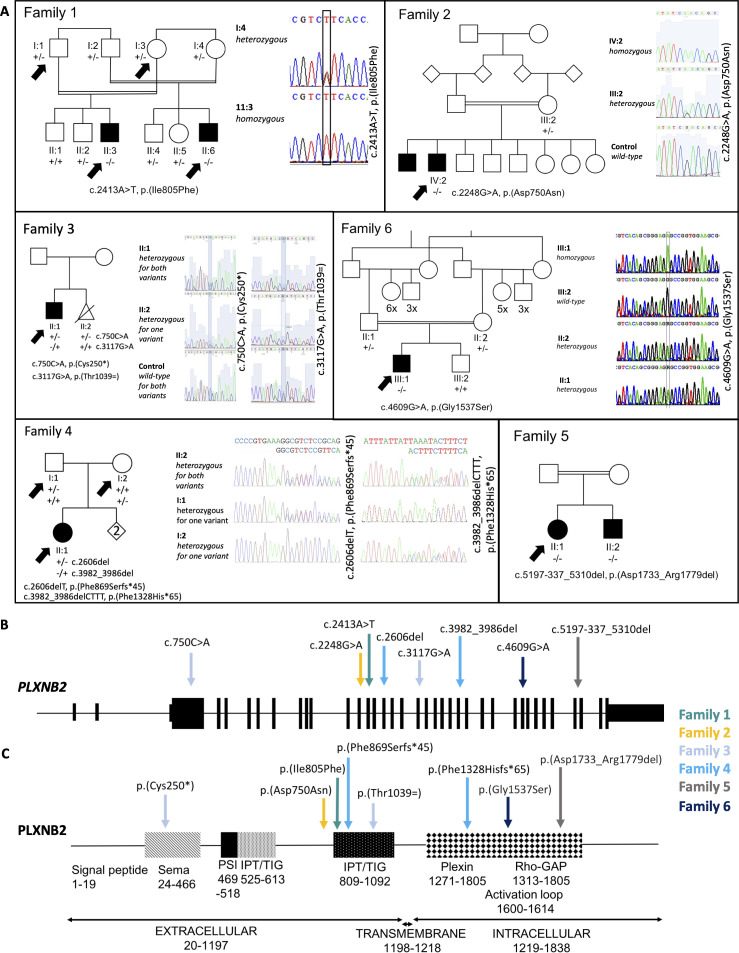
Figure 1.
Pedigrees, Sanger sequencing and schematic diagram of the PLXNB2 protein. (A) DNA was available for all labelled individuals on each pedigree. Arrows indicate the individuals whose DNA was exome or genome sequenced. Affected status is as reported by the families for individuals for which DNA was not available. Sanger sequencing traces showing the segregation of each variant with disease in each family, except for Family 5, for which this is shown in online supplemental figure 9. The schematic diagram shows (B) the PLXNB2 transcript (ENST00000359337.9, NM_012401.4; 6409 bp) and (C) the PLXNB2 protein (ENSP00000352288.4, NP_036533.2; 1838 amino acids), with the positions marked for the pathogenic variants identified in this study. IPT, immunoglobulin, plexin and transcription factor; PSI, plexin, semaphorin and integrin; TIG, transcription factor immunoglobin.

