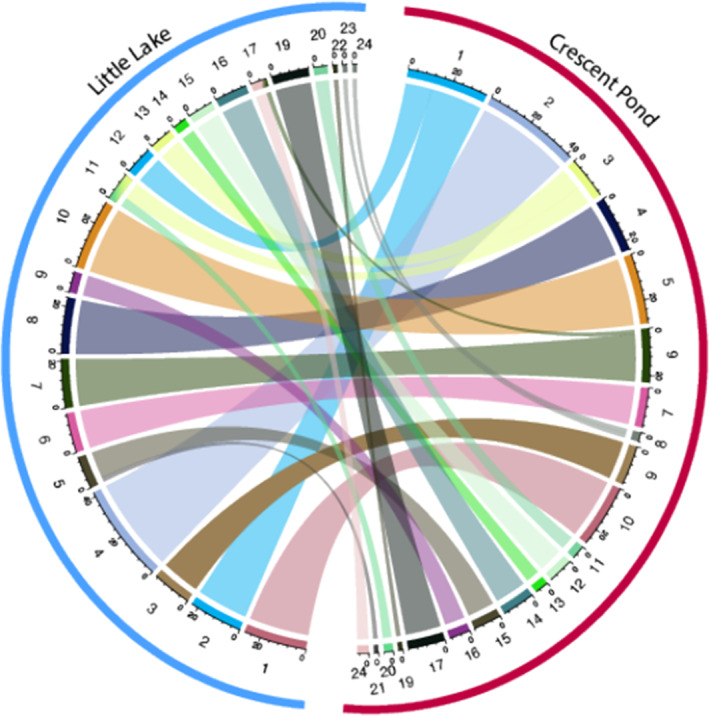
FIGURE 3.

Circos plot depicting the relationship between the Crescent Pond (red) and Little Lake linkage maps (blue), which share 324 markers within 10 kbp of one another. Numbers surrounding each semi‐circle represent linkage group numbers in each lake. Markers that are shared across lakes are connected via the colored
