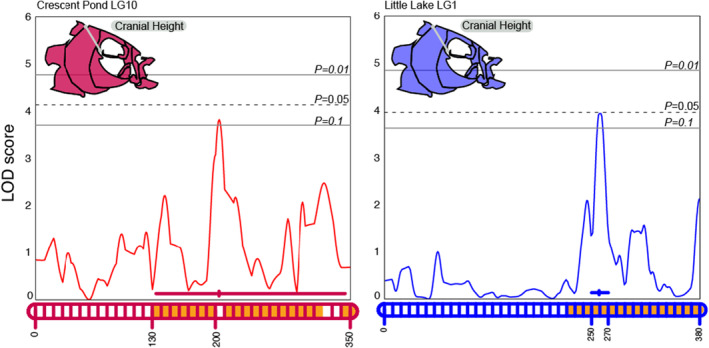
FIGURE 4.

LOD profile for cranial height in Crescent Pond (red) and Little Lake (blue) F2 hybrids. LOD profiles were estimated by a Haley–Knott regression and are plotted relative to the position along the implicated linkage group (LG 10 for Crescent Pond, LG 1 for Little Lake) which are represented along the X‐axis. Genome‐wide significance levels of p = .1, .05, and .01 are shown by the gray horizontal lines. Linkage groups along the X‐axis also show the position of maximum LOD along with 95% Bayesian credible intervals. The orange fill color within the linkage groups corresponds to overlapping regions of scaffold 33 between crosses.
