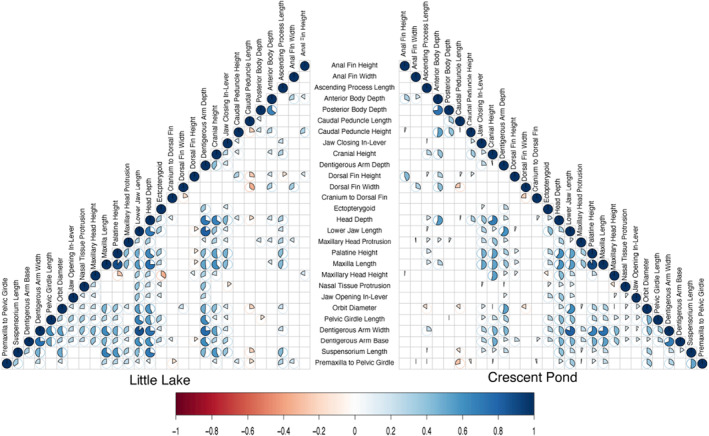
FIGURE 6.

Correlation matrices depicting the relationship between phenotypic traits in Little Lake and Crescent Pond. Visualized pie charts represent relationships that are significant at the p < .05 level. Red pie charts represent negative relationships and blue pie charts represent positive relationships.
