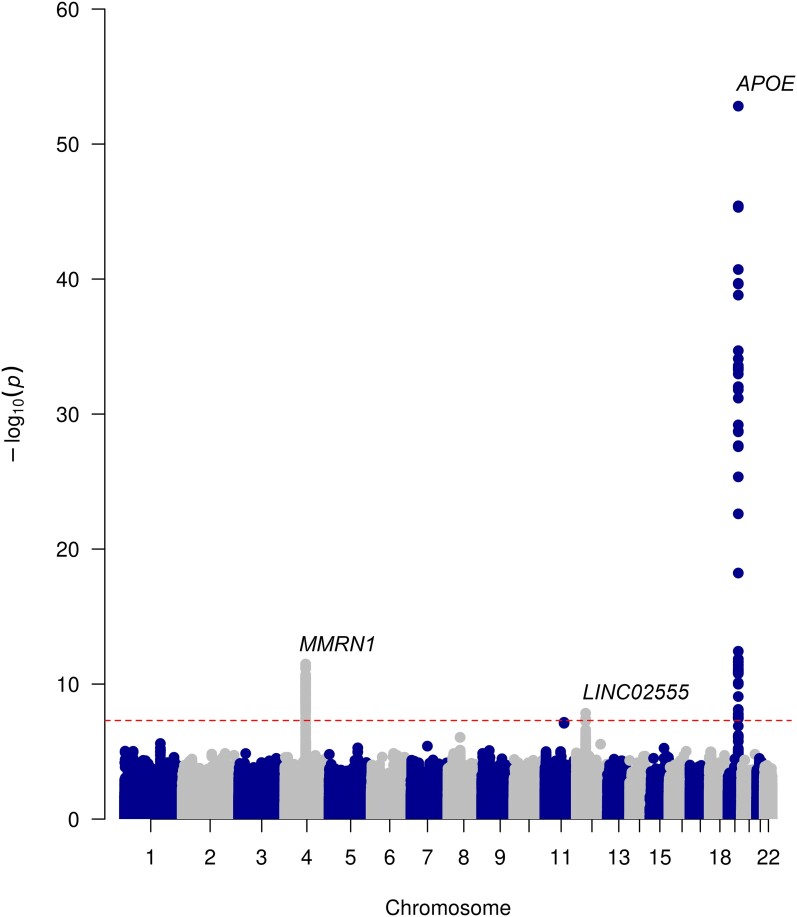
Figure 1.
Manhattan plot of LBD-D versus LBD-ND. A Manhattan plot representing the results of the case–case genome-wide association study results (n = 2908 Lewy body disorders with dementia and n = 4896 Lewy body disorders without dementia), where 6 877 765 variants have been analysed under a logistic regression model. The plot highlights genome-wide significant single nuclear variants on chromosome 4 (rs7668531, P = 3.25e−12), 12 (rs17442721, P = 1.44e−08) and 19 (rs429358, P = 3.25e−57). Negative logarithm P-value is represented on the y-axis, while chromosome position is represented on the x-axis. The dotted line indicates genome-wide significant threshold (5 × 10⁻⁸).

