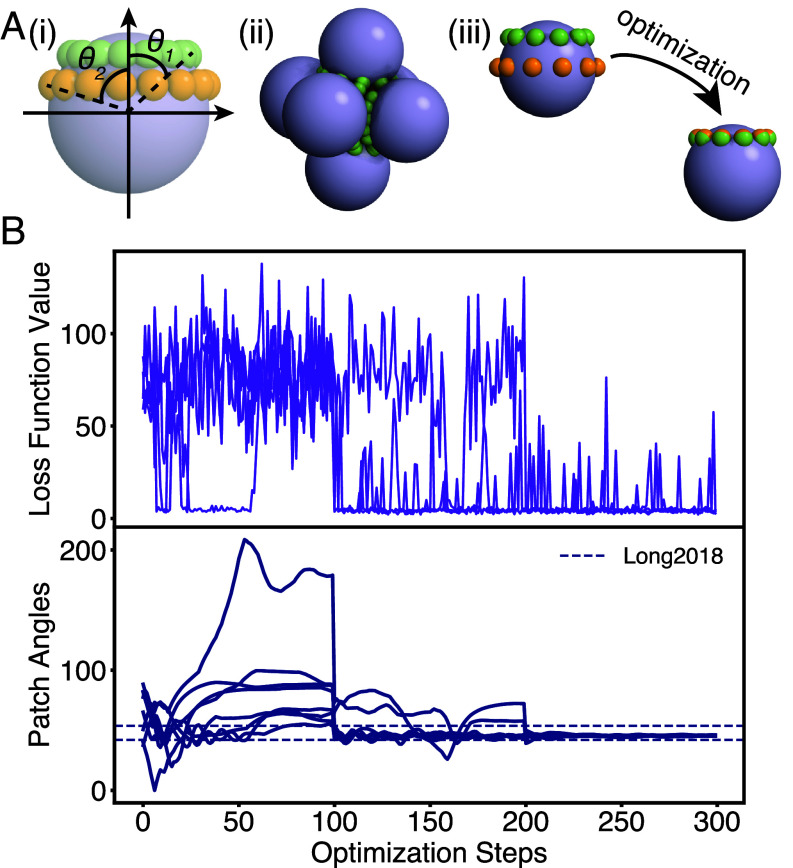
Fig. 4.
Stabilization of octahedral cluster. (A) (i) patchy particle model used to optimize for octahedral cluster. and determine the locations of the two rings of patches, where each ring has A-A type attractions. (ii) sample octahedral cluster (iii) patchy particle evolution from the beginning to the end of an optimization run. (B) Ensemble of optimization results for stabilization of an octahedral cluster. The -axis shows the optimization steps. The -axis shows the patch opening angle on the Bottom plot (navy), and the loss function on the Top plot (purple). The dotted lines show the optimized parameters from ref. 24. Over the course of the optimization, the two patch angles converge to the same value and fall into the range of the literature optimized values. The set of independent optimization runs all converge to the same optimal patch angles. 3D particles and trajectories are rendered by INJAVIS (48).

