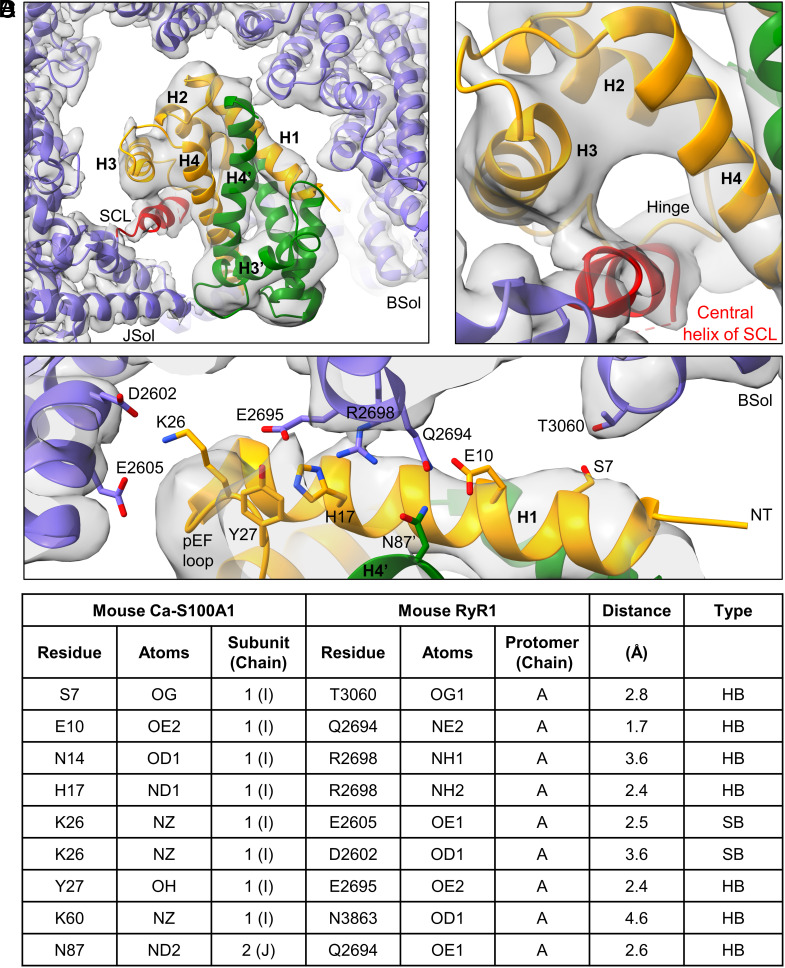
Fig. 2.
Local interaction hot spots between RyR1 and Ca-S100A1. (A) Overview of the Ca-S100A1 binding site of RyR1 (cryo-EM map in gray). The monomeric subunits 1 (orange) and 2 (green) of homodimeric S100A1 and the surrounding binding site of RyR1 (violet) are depicted as ribbon models (PDB: 8VK4). (B) Interaction site between the SCL of RyR1 and subunit 1 of Ca-S100A1. The central helix (red) of the SCL binds into the hydrophobic pocket formed by helices H3-H4 and the hinge region of subunit 1. (C) Interaction site between the BSol domain of RyR1 and subunit 1 of Ca-S100A1. Helix H1 of subunit 1 forms close contacts with the BSol domain. (D) Table of S100A1-RyR1 side chain interactions predicted by the atomic model under Ca2+-saturated condition. The listed H-bonds (HB) and salt bridges (SB) of side chains (depicted in C) are only putative, given limitations in resolution and potential dynamic changes of S100A1 binding.

