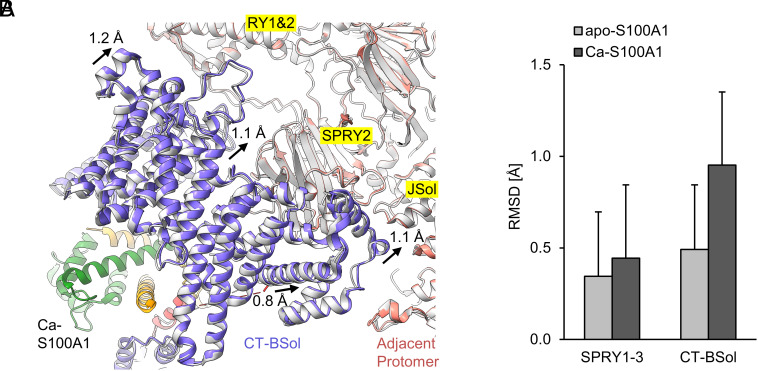
Fig. 4.
Sideways motion of the C-terminal BSol region upon binding of Ca-S100A1. (A) View from below the S100A1 binding site of RyR1. The atomic models of RyR1-S100A1 (colored; PDB: 8VK4) and all RyR1 particles (gray; PDB: 8VJK) are superimposed under Ca2+-saturated conditions (250 µM free Ca2+/caffeine/ATP). Upon Ca-S100A1 binding (subunit 1 in orange, subunit 2 in green), the CT-BSol region (violet) moved sideways by ~1 Å toward the RY1&2, SPRY2, and JSol domains of the adjacent protomer (salmon). (B) Local C-alpha RMSD were calculated for the superimposed structures at the SPRY1-3 region (a.a. 629-1657 in mouse RyR1) and CT-BSol region (a.a. 2950-3613). Compared to SPRY1-3, CT-BSol showed a substantially increased RMSD value upon binding of Ca-S100A1 but not for apo-S100A1.

