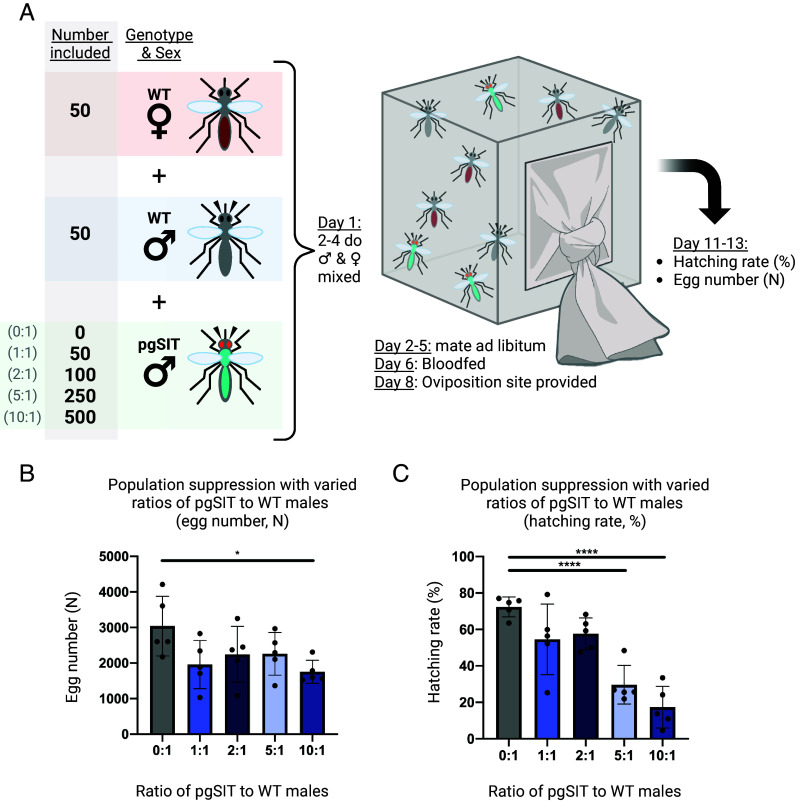
Fig. 2.
Population suppression following release of pgSIT males at different ratios to wild type. (A) Test suppression cages were established with 50 wild type males, 50 wild type virgin females, and either 0, 50,100, 250, or 500 pgSITD15 males (for the 0:1, 1:1, 2:1, 5:1, and 10:1 pgSIT:wild type male ratios respectively). After mating and blood feeding, the hatching rate was calculated for each cage. (B) The egg counts from population suppression assay cages. Groups 0:1 and 10:1 are significantly different (P < 0.05, Dunnett’s multiple comparisons). Mean and SD shown. (C) Population suppression as measured by the hatching rate (%) from cages suppressed by different ratios of pgSIT males to wild type males. Hatching rate is reported as the percent of eggs which hatched (n% = n 1-d-old larvae/n eggs laid). The 0:1 control group differs significantly with both the 5:1 (P < 0.001) and 10:1 (P < 0.001) groups (one-way ANOVA, Dunnett’s multiple comparisons test). Mean and SD shown. Created with Biorender.com.

