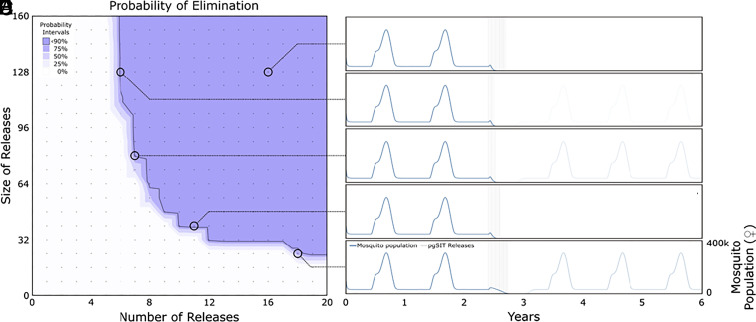
Fig. 3.
Modeling population suppression and elimination by release of pgSIT A. gambiae. Weekly egg releases were simulated in a randomly mixing A. gambiae population resembling the Upper River region of The Gambia using the MGDrivE 3 simulation framework (69) with parameters described in Dataset S7. Probability of A. gambiae population elimination is depicted for a range of release schemes described by the number of consecutive weekly releases and number of pgSIT eggs released per wild-type adult. The contour plot (Left) depicts regions of parameter space for which the local mosquito population is eliminated with probabilities ≥0, 25, 50, 75, or 90% (as measured by the proportion of 100 simulations that lead to elimination). 90% elimination probability is depicted by a solid line. Time-series mosquito population dynamics (Right) are depicted for a selection of scenarios from the contour plot. Releases of pgSIT eggs (female and male) are modeled beginning June 1st (beginning of the Upper River rainy season) in the third year of the simulation. Scenario (A) depicts a large release very likely to achieve elimination (16 weekly releases at a 128:1 ratio of pgSIT eggs to wild adults); scenario (B) depicts a release scheme that achieves transient suppression but not elimination (5 weekly releases at a 128:1 ratio); scenarios (C and D) depict release schemes ~90% likely to achieve elimination (7 weekly releases at an 80:1 ratio, and 10 weekly releases at a 40:1 ratio, respectively); and scenario (E) represents a release scheme with a ~75% elimination probability (18 weekly releases at a 24:1 ratio), with the population rebounding in ~25% of simulations (faint lines in years 4 to 6).

