Fig. 2.
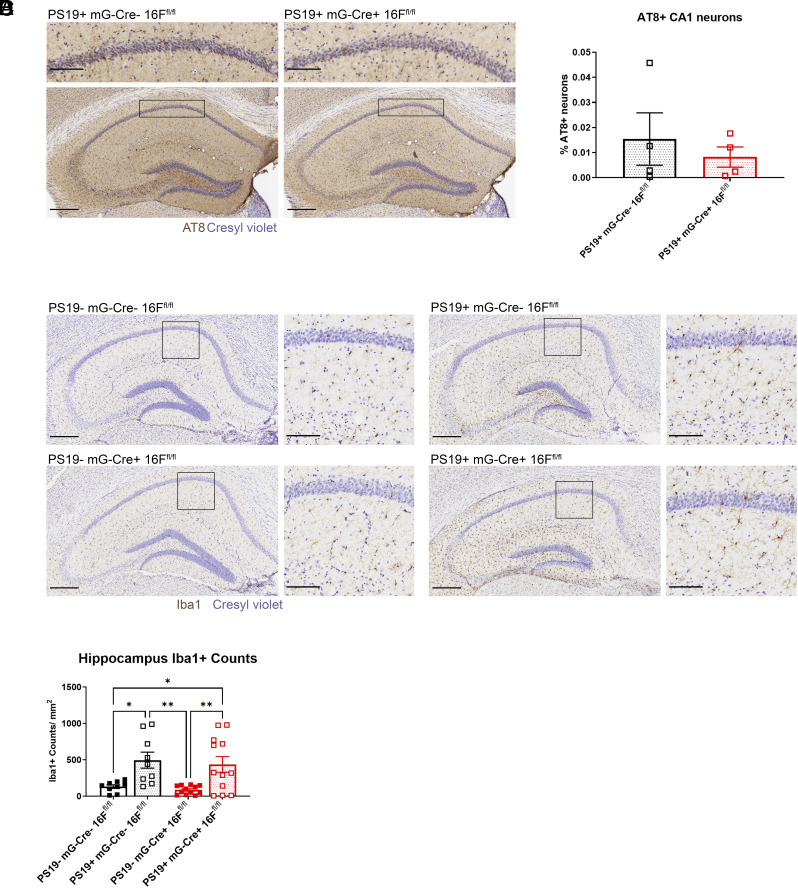
Microglial TMEM16F conditional KO mice without detectable effect on disease pathology. (A) Representative images of AT8 immunostaining of hyperphosphorylated tau in the hippocampus and CA1 (Inset) in 7-mo-old PS19+ microglial TMEM16F WT (mG-Cre− 16Ffl/fl) and microglial TMEM16F conditional KO mice (mG-Cre+ 16Ffl/fl). Cresyl violet, neuronal counterstain. (Scale bar, 300 µm for hippocampus and 100 µm for Inset.) (B) Quantification of AT8+ neurons within CA1 pyramidal layer in PS19+ mG-Cre− 16Ffl/fl, n = 4 and PS19+ mG-Cre+ 16Ffl/fl mice, n = 6; 3 to 4 hippocampal sections/ mouse. % AT8+ neurons gives number of AT8+ neurons normalized by area of interest and total number of neurons per area (neuronal density in the CA1 pyramidal layer) (P = 0.8857, Mann–Whitney test). Error bars in SEM. (C) Representative images of Iba1 immunostaining of microglia in the hippocampus and CA1 (Inset) of 7-mo-old PS19− mG-Cre− 16Ffl/fl, PS19− mG-Cre+ 16Ffl/fl, PS19+ mG-Cre− 16Ffl/fl, and PS19+ mG-Cre+ 16Ffl/fl mice. Cresyl violet, neuronal counterstain. (Scale bar, 300 µm for hippocampus and 100 µm for Inset.) (D) Quantification of number of microglia per area (count/mm2) in the hippocampus of 7-mo-old PS19− mG-Cre− 16Ffl/fl, PS19− mG-Cre+ 16Ffl/fl, PS19+ mG-Cre− 16Ffl/fl, and PS19+ mG-Cre+ 16Ffl/fl mice, n = 4 to 5 per genotype, three ROIs per mouse (*P < 0.05, **P < 0.01, two-way ANOVA, Tukey’s multiple comparisons test). Error bars in SEM.

