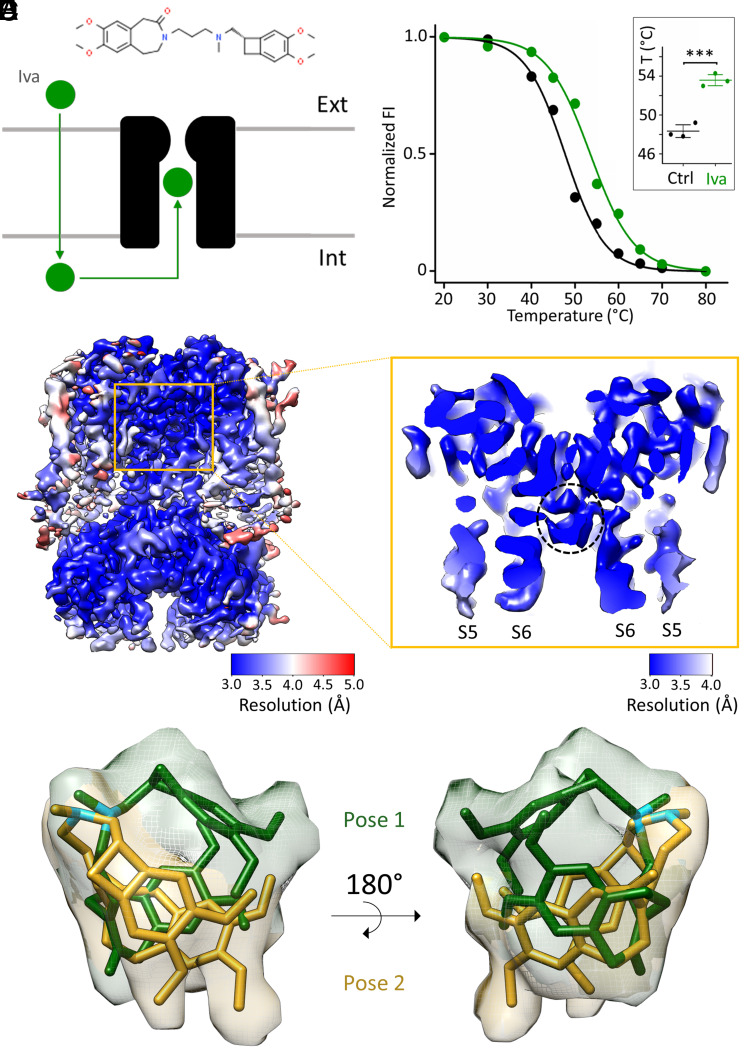
Fig. 1.
Biochemical and structural characterization of ivabradine binding to HCN4. (A) Cartoon representation of ivabradine (green sphere) crossing the plasma membrane and entering the intracellular pore vestibule of HCN4 (black). The chemical structure of ivabradine is shown on Top. (B) Representative denaturing curves of purified GFP-tagged HCN4 protein without (black) and with 0.5 mM ivabradine (green). Normalized fluorescence intensity (FI) is plotted against preconditioning temperature (°C). Solid lines show a sigmoidal dose–response equation fitting to the data (SI Appendix). Inset: Mean Tm values for control (48.3 ± 0.4 °C, black) and + ivabradine (53.6 ± 0.4 °C, green) (n = 3 experiments ± SEM). Statistical analysis was performed with one-way ANOVA, followed by Fisher's test (***P < 0.001). (C) Density map and (D) enlargement of the pore region (S5 and S6 helices are marked) of HCN4 with ivabradine. (D) The pore is open, and the intracellular pore vestibule is occupied by a nonprotein density circled with a dotted black line. Maps are color-coded by local resolution (Å), as indicated by the two bars. (E and F) Ivabradine molecule modeled within the nonprotein density in two different poses: Pose 1 (yellow) and pose 2 (green) (PDB: 8OFI) displaying similar position of the tertiary amine of the aliphatic linker (N atoms colored in light blue) and different orientation of the hydrophobic benzazepinone and benzocyclobutane moieties. Density is zoned around poses 1 and 2 and is colored accordingly.

