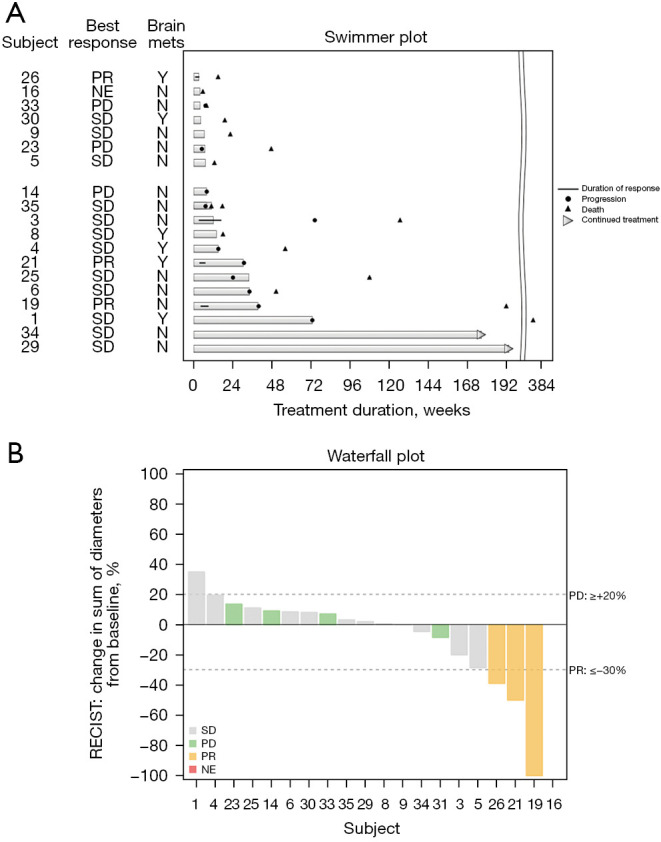
Figure 1.

Efficacy of nintedanib monotherapy. (A) Swimmer plot of duration of response and patient status at time of data analysis. (B) Waterfall plot of best percent change in measurable disease. The sum of the longest diameters of all target lesions was measured at baseline and at time of best response. PR, partial response; Y, yes; NE, not evaluable; N, no; PD, progressive disease; SD, stable disease; RECIST, Response Evaluation Criteria in Solid Tumors.
