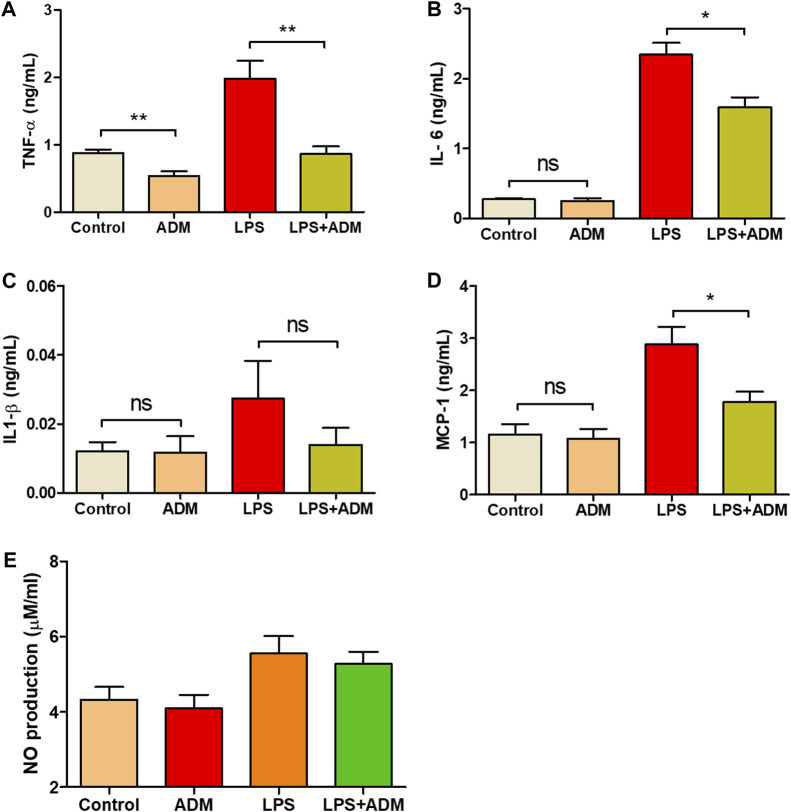
FIGURE 2.
Inflammatory response reduction by ADMs in vitro in which (A) Tumor necrosis factor alpha (TNF-α) (B) Interleukin-6 (IL-6) (C) Interleukin-1 beta (IL-1β) (D) Monocyte chemoattractant protein 1 (MCP-1) by ELISA and (E) Nitric oxide (NO) production by nitrate assay The presented values are the experimental results from in vitro experiments. Data are shown as the mean ± SEM. *p ≤ 0.05, **p ≤ 0.005, ***p ≤ 0.001.

