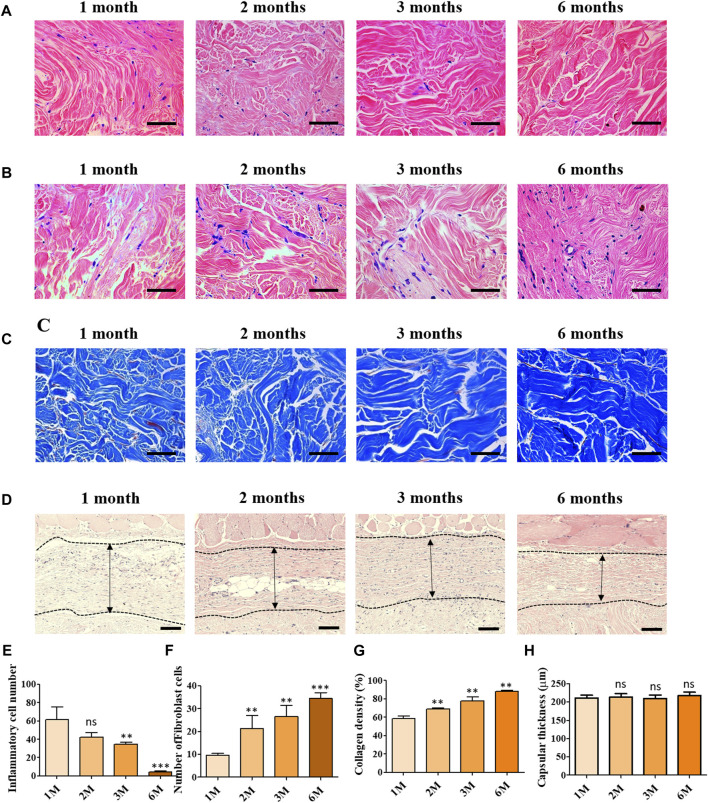
FIGURE 3.
Histological assessment of implanted ADMs in vivo in which (A) Hematoxylin and eosin (H and E) staining for inflammatory cells (B) Hematoxylin and eosin (H and E) staining of fibroblast cell infiltration (C) Masson’s trichrome (MT) staining (D) Hematoxylin and eosin (H and E) staining for capsular formation (E) Quantitative number of inflammatory cells (F) Quantitative number of fibroblast cells and (G) Quantitative result of collagen density (H) Quantitative results of capsular formation. Scale bar = 50 µm. The presented values are the experimental results on 5 rats for each group. Data are shown as the mean ± SEM. **p ≤ 0.005, ***p ≤ 0.001.

