
Figure 3.
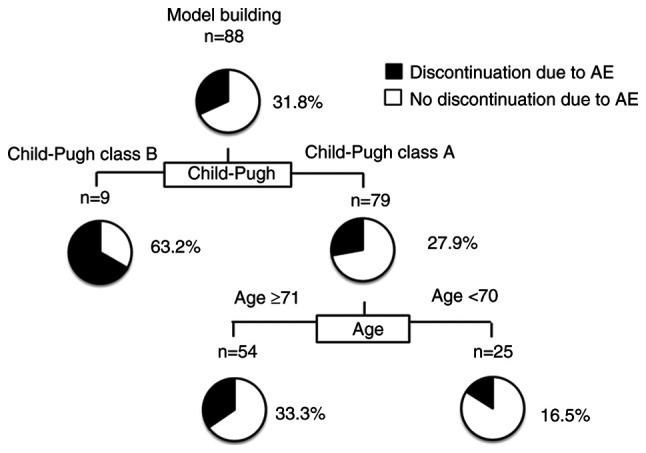
Profiles associated with discontinuation due to AEs in patients with HCC treated with Dur/Tre. Decision-tree algorithm for discontinuation due to AEs. The pie graphs indicate the percentage of no discontinuation due to AEs (white)/ discontinuation due to AEs (black) in each group. HCC, hepatocellular carcinoma; Dur/Tre, durvalumab plus tremelimumab.