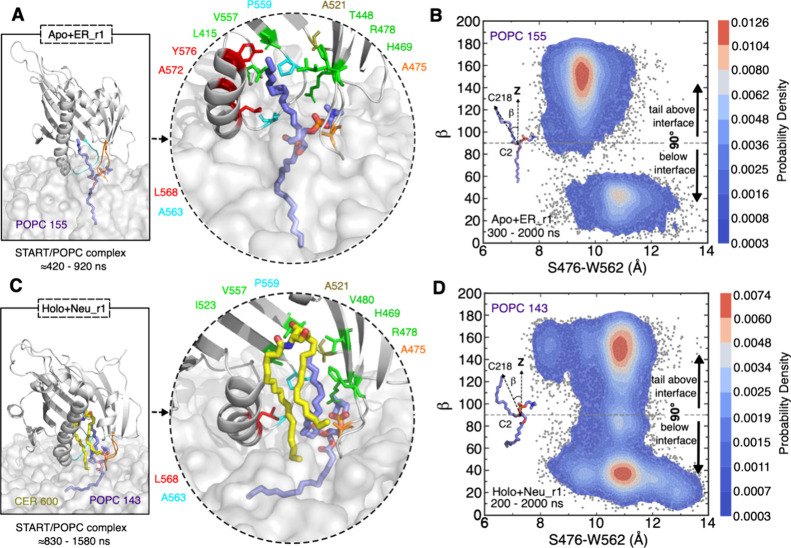
Figure 4.
POPC (1-palmitoyl-2-oleoyl-phosphatidylcholine) rearrangement induced by the START domain in the open state detected by MD simulation. (A) Close-up view of the binding conformation of POPC within the apo START domain and the amino acids in the cavity involved in hydrophobic contacts with the POPC tail in the ER bilayer. The START domain is shown as gray cartoons with Ω1 in orange and Ω4 in cyan, ceramide and POPC as yellow and purple sticks, respectively, and the bilayer as a gray transparent surface. The times at which the POPC tail inserts into and exits the cavity are given below the snapshots. (B) Distribution of the POPC tail angle with respect to the membrane normal in the ER bilayer and their estimated probability density (KDE function) are presented. The gray dots represent all the sampled tilt angles. (C) Close-up view of the binding conformation of POPC within the START-Cer complex and the amino acids in the cavity involved in hydrophobic contacts with the POPC tail in the neutral bilayer. (D) Distribution of the POPC tail angle with respect to the membrane normal in the neutral bilayer and their estimated probability density (KDE function) are presented. The KDE represents the data by using a continuous probability density curve. The bar at the right side shows the intensity of data values along the KDE curve.

