Fig. 2.
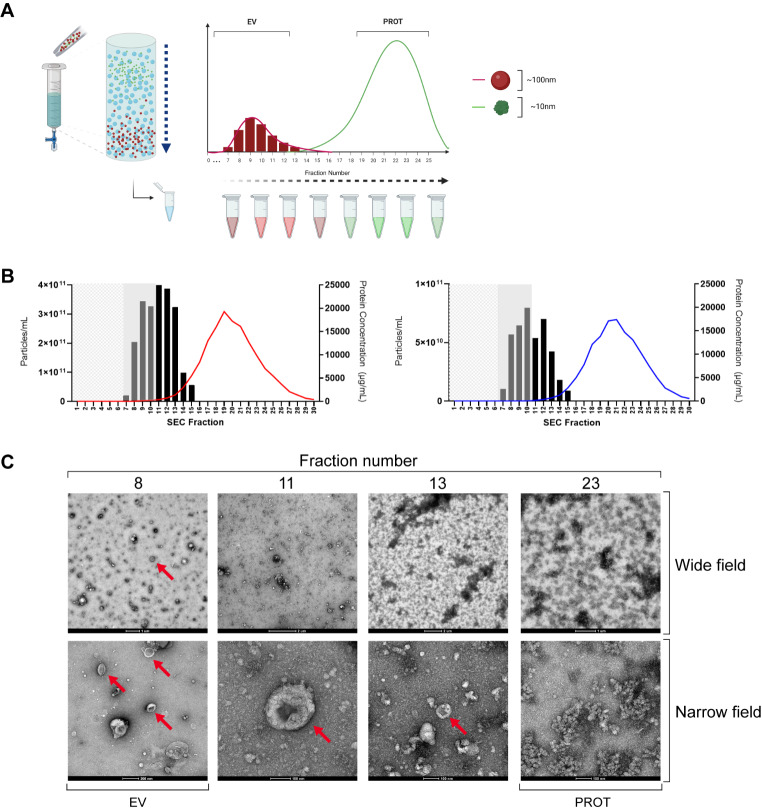
SEC-isolation of plasma EVs. (A) SEC using Izon column separates EVs with a size discrimination of 70–100 nm and was performed for a characterisation of 3 PDAC and 3 benign samples. A volume of 1 mL of plasma was loaded to the column and PBS continuously added with 500 µL fractions eluted for subsequent analysis. The column void volume was approximately 3 ml and protein concentrations were measured using a BCA assay. (B) Particle and protein concentrations were obtained by NTA and BCA for each of the fractions shown and averages for each fraction are shown in (left) PDAC and (right) benign disease. Mean particle concentrations are shown as columns with protein levels shown as a coloured trendline (red – PDAC, blue – Benign). (C) TEM of a representative PDAC sample shows EVs (red arrows). Images taken at high magnification (60,000–72,000x) are labelled as ‘Narrow field’ whilst intermediate magnification (4-5000x) are labelled as ‘Wide field’. BCA: bicinchoninic acid; EV: extracellular vesicle; NTA: nanoparticle tracking analysis; PBS: phosphate buffered saline; PDAC: pancreatic ductal adenocarcinoma; SEC: size exclusion chromatography; TEM: transmission electron microscopy

