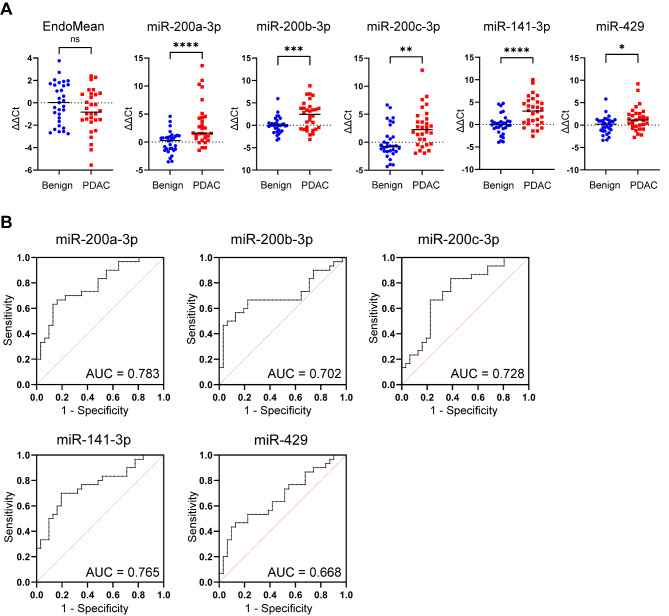
Fig. 5.
Validation of miR-200 family in plasma EV samples using RT-qPCR. (A) Expression of the EndoMean (the geometric mean of endogenous normalisers miR-23a, miR-26a and exogenous UniSp6) and the miR-200 family (miR-200a, miR-200b, miR-200c, miR-141 and miR-429) in plasma EV samples for the pairwise comparison: 30 PDAC vs. 31 benign. (B) Receiver operating curves with area under the curve (AUC) for each individual miR-200 family member is generated from logistic regression of the RT-qPCR expression. *p < 0.05, **p < 0.005, ***p < 0.0005, ****p < 0.0001

