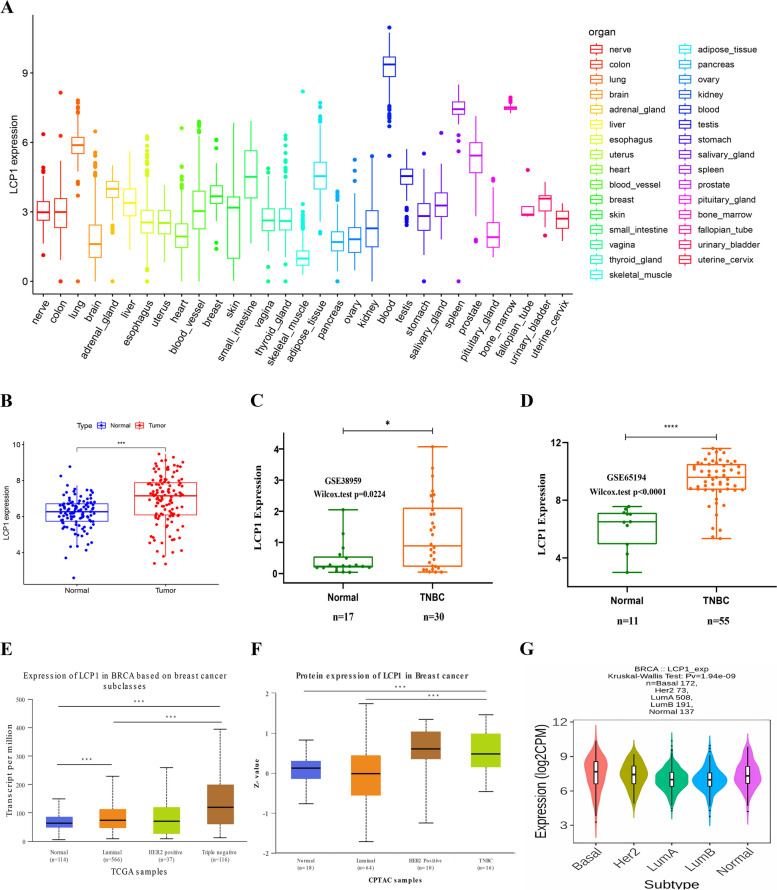
Fig. 1.
The mRNA level of LCP1 in normal tissues and TNBC. A The LCP1mRNA level in human normal tissues using Genotype Tissue-Expression (GTEX) data. B Comparison of the LCP1 mRNA level in TCGA-TNBC and TCGA normal breast tissues. The red dots represent the cancer samples, and the blue dots represents the normal samples. C, D Comparison of the LCP1 mRNA level in TNBC tissues and normal tissues validated by GSE38959 and GSE65194 datasets. E The mRNA level Expression of LCP1 in BRCA based on breast cancer subclasses(Normal-vs-Luminal P= 3.58529999999746E-05, Normal-vs-TNBC P= 7.85030040972856E-10; Luminal-vs-TNBC P= 2.06219999999702E-05). F LCP1 proteomic expression profile based on Major subclass using data from Clinical Proteomic Tumor Analysis Consortium (CPTAC) and the International Cancer Proteogenome Consortium (ICPC) datasets(Normal-vs-TNBC P=1.705679E-02;Luminal-vs-TNBC P= 3.499659E-03). G The mRNA level of LCP1 in different breast cancer subtypes in TCGA database.*, P < 0.05; **, P < 0.01; and ***, P < 0.001

