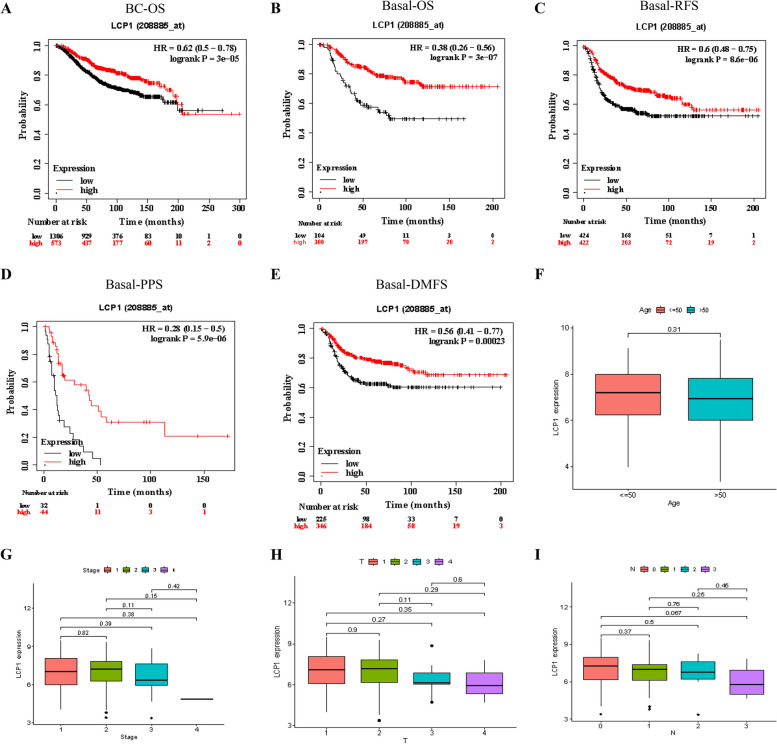
Fig. 2.
Clinical Implications of LCP1 in TNBC. A-B Kaplan–Meier survival curves illustrating the impact of LCP1 expression on overall survival in both broad BC and basal-like BC patient groups (Probe ID: 208885_at). C Kaplan–Meier analysis assessing relapse-free survival in basal-like BC patients in relation to LCP1 expression. D Kaplan–Meier curve depicting post-progression survival in basal-like BC patients, correlated with LCP1 expression. E Kaplan–Meier survival analysis for distant metastasis-free survival in basal-like BC patients, linked to LCP1 expression. Patients with expression levels above the median are shown in red, and those below the median in black. HR stands for hazard ratio. F-H Evaluation of the relationship between LCP1 expression and various clinical parameters (age, stage, tumor size, and node status) in TNBC patients

