Figure 3.
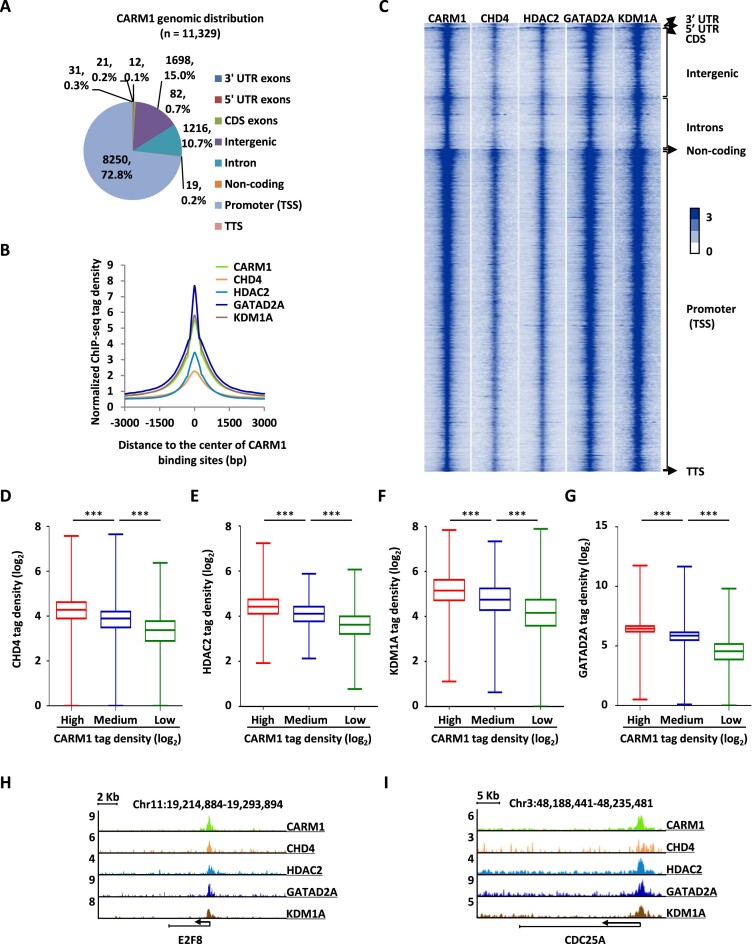
CARM1 and NuRD complex occupy a large number of chromatin sites in common. (A) Genomic distribution of CARM1 binding sites identified by ChIP-seq. (B, C) Histogram (B) and heat map (C) representation of CARM1, CHD4, HDAC2, GATAD2A and KDM1A ChIP-seq tag density centered on CARM1 binding sites. bp: base pair. (D–G) Box plot representation of ChIP tag density (log2) of CHD4 (D), HDAC2 (E), KDM1A (F) and GATAD2A (G) on CARM1 binding sites, which were divided into three sub-classes, high, medium and low based on ChIP-seq tag density (± s.e.m., ***P < 0.001). (H, I) Genome browser views of CARM1, CHD4, HDAC2, GATAD2A and KDM1A ChIP-seq on E2F8 (H) and CDC25A (I) genes.

