Figure 4.
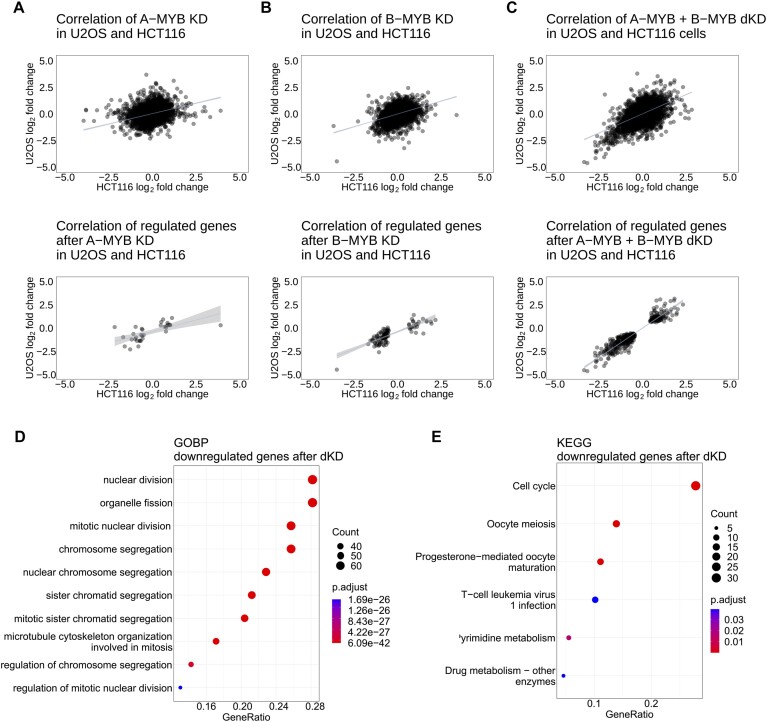
A-MYB and B-MYB double knockdown but not single knockdowns influence RNA expression. Affected target genes are associated with mitosis. The correlation of expression of all RNA-seq hits (upper diagrams) and differentially expressed genes (lower diagrams) in HCT116 (log2 fold-change on the x-axis) and U2OS cells (log2 fold-change on the y-axis) was generated for (A) A-MYB KD, (B) B-MYB KD and (C) A-MYB + B-MYB dKD relative to the control (Ctrl KD). Genes were considered differentially expressed, if the log2 fold-change adjusted P-value was <0.01. For each scatter plot a linear regression with a 95% confidence interval of all data points was calculated. For A-MYB + B-MYB dKD a GOBP (D) and KEGG (E) analysis of genes significantly downregulated in HCT116 and U2OS cells were performed. For linear regression values see Supplementary Table S3.

