Figure 5.
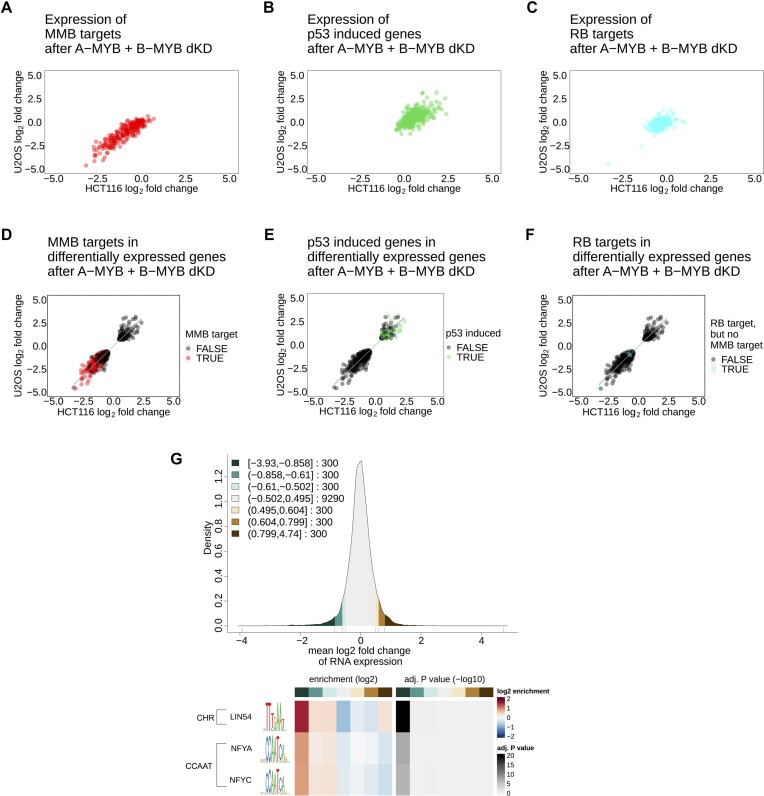
A-MYB + B-MYB double knockdown affects B-MYB-MuvB targets and leads to p53 target induction without affecting RB targets. The correlation of RNA-seq hits after A-MYB and B-MYB double knockdown in HCT116 (x-axis) and U2OS cells (y-axis) was filtered for (A) MYB-MuvB targets from targetgenereg.org in red, (B) p53 upregulated genes with a score ≥30 from targetgenereg.org in green, or (C) RB targets but not MYB-MuvB targets in targetgenereg.org in blue. To show the portion of each gene set within all regulated genes, the correlation of genes differentially expressed in HCT116 (x-axis) and U2OS cells (y-axis) was highlighted with (D) MYB-MuvB targets from targetgenereg.org in red, (E) p53 upregulated genes with a score ≥30 from targetgenereg.org in green, or (F) RB targets but not MYB-MuvB targets in targetgenereg.org in blue. For scatter plots (D, E and F) a linear regression with 95% confidence interval of all data points was calculated. To analyze the enrichment of motifs in the promoter regions of regulated genes after A-MYB + B-MYB dKD, the gene regulation in HCT116 and U2OS cells was averaged to a mean log2 fold-change and down- and upregulated genes were clustered in sets of 300 genes. The distribution of gene regulation after A-MYB + B-MYB dKD is shown as a density plot (G) with green scales for downregulated genes and brown scales for upregulated genes. The resulting seven clusters (3 downregulated gene clusters, 1 unregulated gene cluster, 3 upregulated gene clusters) were analyzed for motif enrichment from the JASPAR database in their core promoter region (−200 bp to +50 bp from the transcriptional start site). The enrichment and the significance of the enrichment are depicted as a heatmap (H) for each motif that was significantly (P < 0.05) enriched with a false discovery rate <10−3 in the up- or downregulated clusters. For linear regression values see Supplementary Table S3.

