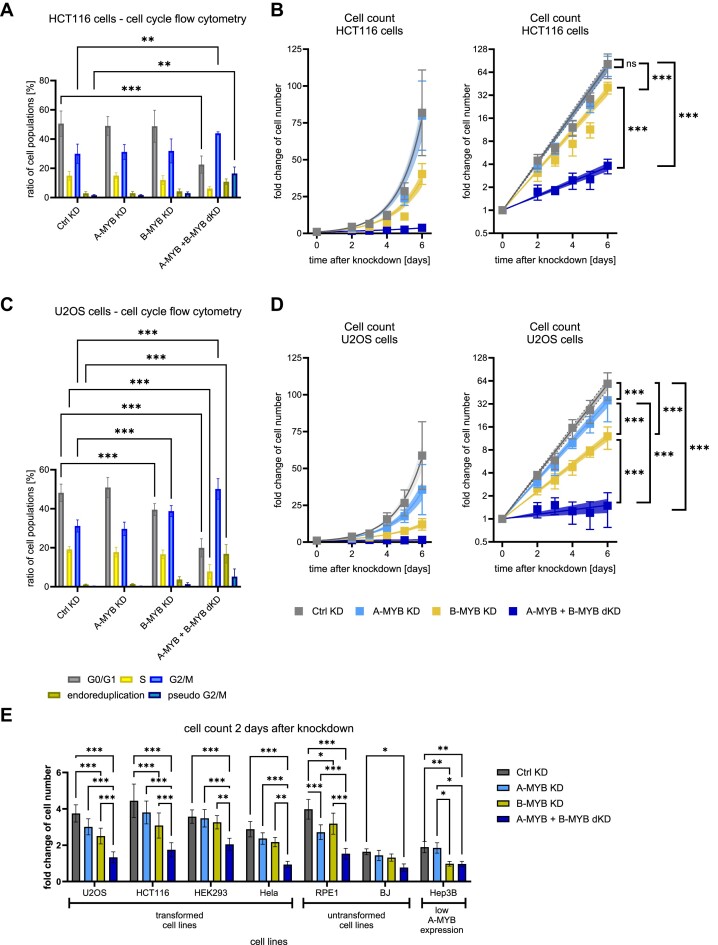
Figure 7.
A-MYB compensates for B-MYB loss in proliferation and causes a lower rate of G2/M-arrested cells as well as a lower rate of DNA aberrations. siRNA knockdown was performed on HCT116 (A, B) and U2OS cells (C, D). For flow cytometric analysis of DNA content to evaluate cell cycle distribution, (A) HCT116 (n = 3) and (C) U2OS (n = 5) cells were harvested 48 h after knockdown. Significance tests were performed for the change of the cell population ratio between Ctrl KD and the other conditions. To evaluate the change in cell numbers after knockdown, (B) HCT116 (n = 3) and (D) U2OS cells (n = 3) were counted every 24 h beginning from the second day after siRNA transfection. To assure a stable knockdown throughout the experiment, cells were re-transfected with siRNA after 72 h. Graphs on the left show exponential regression on a linear scale and graphs on the right display the same regression on a logarithmic scale. (E) siRNA knockdown was performed on the transformed cell lines U2OS, HCT116, HEK293 and HeLa, the untransformed cell lines RPE-1, and BJ, as well as the transformed cell line Hep3B with reportedly low A-MYB expression. Cells were counted two days after knockdown. Mean ± SD are given, and significances were calculated by two-way ANOVA (*P < 0.05; **P < 0.01; ***P < 0.001). Exponential regression curves are displayed with 95% confidence intervals. Significances between exponential regression curves were calculated by Extra sum-of-squares F test (ns, not significant; ***P < 0.001).

