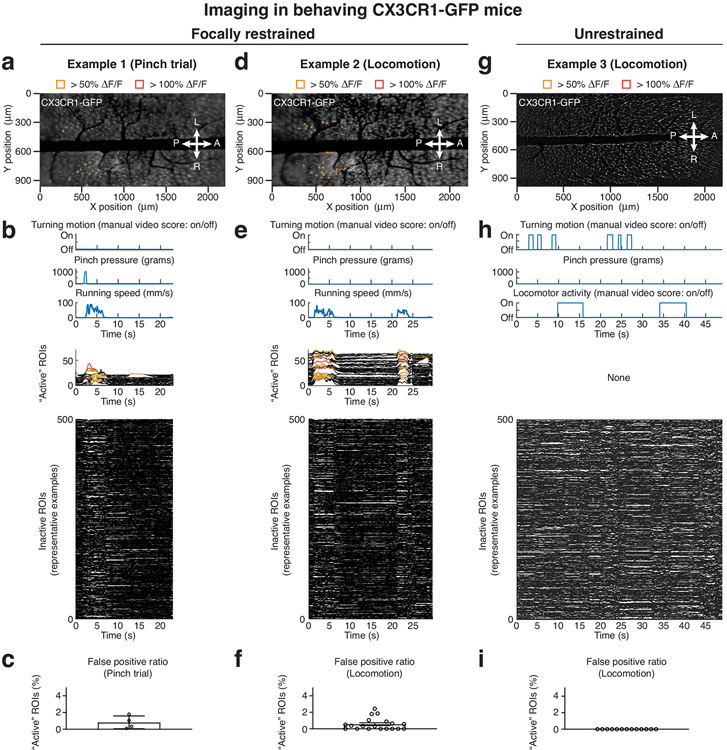
Extended Data Fig. 8 ∣. Stable trans-segmental imaging in focally restrained and freely moving CX3CR1-GFP mice.
a,d,g, Average intensity projection images from time-lapse recordings in focally restrained (a,d) or freely behaving CX3CR1-GFP mice (g) (Supplementary Videos 2, 4) overlaid with ~10 μm × 10 μm ROIs. Only ‘active’ ROIs above the indicated ΔF/F thresholds are shown. The chosen ΔF/F thresholds are based on image noise levels, depend on fluorescent indicator expression and were consistently applied across all animals of the same strain. b,e,h, Top, animal behaviors (turning, locomotion) and sensory stimulus application (tail pinch) during the example recordings shown in a,d,g and Supplementary Videos 2, 4. Center, all computationally identified ‘active’ ROIs. Bottom, 500 representative inactive ROIs. Locomotor activity evoked sparse, distributed, and synchronized transients with onset, offset, and plateau kinetics in CX3CR1-GFP mice distinct from cellular activity seen in CX3CR1-GCaMP5g-tdTomato animals (Extended Data Fig. 9). These false positives tended to occur more frequently or with larger amplitude in focally restrained (a and d) compared to freely behaving mice (g), likely due to the larger forces acting on the spinal implant during running when restrained. c,f,i, Population analysis of false positive ratios (‘active’ ROIs/total ROIs) for focally restrained or freely behaving CX3CR1-GFP mice. The data in c, f, and i are from 4, 13, and 19 trials with comparable behavior or stimuli. All data are presented as mean ± s.e.m. (c, 0.82 ± 0.38; f, 0.57 ± 0.17; i, 0). Data with functional calcium indicator expression are shown in Extended Data Fig. 9 and Supplementary Video 5.

