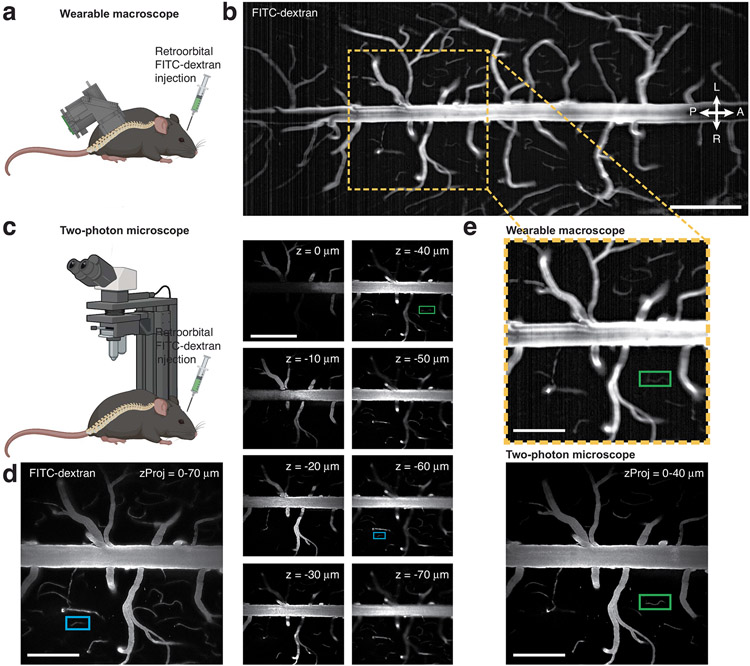
Extended Data Fig. 4 ∣. Wearable macroscopes with custom-compound microlenses offer an extended depth of field.
a,c, Schematics of the experimental approach. A wild-type mouse was prepared with a lumbar spinal window, injected retroorbitally with FITC-dextran (2% w/v), and imaged with both the wearable macroscope (a–b) and a two-photon microscope (c–d) under anesthesia. b, Average intensity image from a time-lapse recording acquired with the wearable macroscope at a set focal depth. Images were acquired at 45 fps (Supplementary Video 1). A 45-frame/1-s average is shown. Scale bar, 500 μm. d, Right, example images from a two-photon z stack acquired with 1 μm axial step size at the FOV location indicated in a (yellow box). z = 0 μm denotes the tissue surface. Each image represents a 2-frame/1-s average. Scale bar, 500 μm. Left, maximum-intensity projection image over a 70 μm-thick tissue volume. Scale bar, 250 μm. e, Comparison of the macroscope (top) and two-photon maximum intensity projection images of various z extent (bottom; 40 μm thickness) reveals that the wearable device has a ~40 μm depth of field. The green box indicates an example microvessel seen in both the one- and two-photon data, whereas the blue box indicates a capillary seen only in two-photon images at tissue depths exceeding 40 μm. Scale bars, 250 μm. All images are representatives from one sample. Images with similar properties were obtained across multiple independent samples or regions.

